
Fig. 2
- ID
- ZDB-FIG-220516-13
- Publication
- Sun et al., 2022 - Mammalian eIF4E2-GSK3β maintains basal phosphorylation of p53 to resist senescence under hypoxia
- Other Figures
- All Figure Page
- Back to All Figure Page
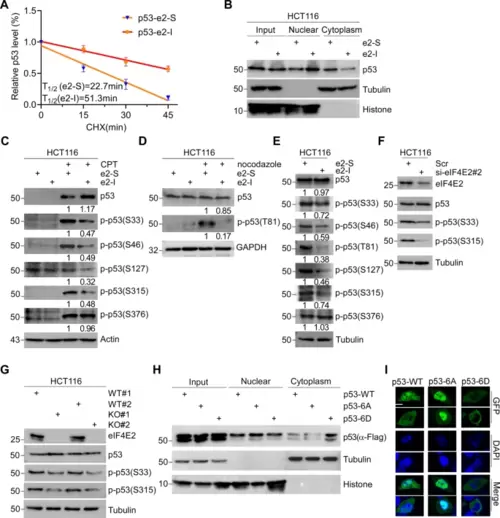
A HCT116 cells were treated with e2-I for 24 h followed by treatment with cycloheximide (CHX) for the indicated times. The intensity of p53 expression for each time point was quantified by grayscale analysis and plotted against time. B e2-I promotes nuclear localization of p53. Cells were treated with 5 μM e2-I or scrambled e2-S for 24 h, then the nuclear fraction was separated from the cytoplasmic fraction, followed by WB with antibodies against p53, Tubulin (markers for cytoplasmic), and Histone (markers for nuclear). C e2-I inhibits the CPT-induced phosphorylation of p53 at multi-S-P. Cells were treated with peptide as in (B), along with mock-treated or treated with 200 nM CPT for 24 h, followed by WB. D e2-I inhibits the nocodazole-induced phosphorylation of p53-Thr81. The experiment was done as described in (C), except that cell were mock-treated or treated with nocodazole (50 ng/ml). E e2-I inhibits multi-S/T-P phosphorylation of p53 at basal conditions. F Depletion of eIF4E2 inhibits the phosphorylation of p53-Ser33 and p53-Ser315. eIF4E2 siRNA#2 was transfected into HCT116 cells for 72 h, followed by WB with indicated antibodies. G Knockout of eIF4E2 inhibits the phosphorylation of p53-Ser33 and p53-Ser315. Lysis of eIF4E2-KO HCT116 (KO) and isogenic wild-type HCT116 (WT) cells, followed by WB with indicated antibodies. H Mutant p53-6A is preferentially located in the nuclear. Vectors expressing FLAG tagged p53, p53-6A or p53-6D, were transfected into p53-null HCT116 cells for 48 h. The nuclear and cytoplasmic fractions were separated, followed by WB. I Green fluorescent signals showed that mutant p53-6A is preferentially located in nuclear. Vectors expressing GFP-fused p53, p53-6A or p53-6D, were transfected into p53-null HCT116 cells for 24 h. GFP fluorescence and DAPI staining were observed using confocal microscopy. Scale bars, 5 μm. |