FIGURE SUMMARY
Title

Egr1 is necessary for forebrain dopaminergic signaling during social behavior

Authors
Tallafuss, A., Stednitz, S.J., Voeun, M., Levichev, A., Larsch, J., Eisen, J., Washbourne, P.
Source
Full text @ eNeuro

egr1 is expressed in the forebrain. A, ISH reveals egr1 expression (blue) in the basal forebrain (BF), optic tectum (OT), hypothalamus (Hyp), and epithelial cells of the pharyngeal pouch (PP) at 6 dpf. myogenin d was used as a control probe (red). Anterior to the left. Scale bar: 100 μm. B, Magnification of the BF (white box in A) showing expression surrounding the anterior commissure (AC). C, Exon organization of the egr1 mRNA, location of the zinc finger domains (zf), and location of the sa64 mutation (red bar). D, egr1sa64 mutants (−/−) develop a normal body plan with functional swim bladder, but with size deficits (bottom). E, Close to 80% of mutant larvae are stunted (dark gray). F, More than 50% of stunted larvae are also wt (+/+, white) and het animals (+/−, light gray). N = 8 clutches, n = 248 animals.

egr1 mutants are less social than wt larvae. A, Larvae from an incross of egr1sa64 were placed in roughly size-matched split dyads at 14 dpf and tested for social orienting and place preference, with the ability to see a sibling through glass. Genotypes [wt (white), het (gray), mut (dark gray)] were determined after testing. B, egr1 mutants spent less time orienting at angles between 45° and 90° to the divider. n = 56 animals, *p < 0.001 (mmANOVA). C, Relative place preference, as measured from the wall opposite the divider and normalized to the total length, revealed less social engagement for egr1 mutants. Zero denotes distance furthest from the divider. *p < 0.05 (HSD). D, There was no difference in overall activity measured as percent time in motion. Time orienting at angles between 45° and 90° (E) and relative place preference (F) for het and wt larvae based on the genotype of the stimulus larvae (stimulus fish genotype) revealed that a deficit in the mutants is detected by the het and wt larvae; *p < 0.001 (mmANOVA). Solid black line represents the median, dotted gray lines represent the upper and lower quartiles.

egr1 mutants are less social with virtual stimuli than wt larvae. A, Biological motion-based social behavior was assayed by projecting dots of different sizes to dishes from below, while recording with an IR camera from above. B, Violin plots revealed significant differences for egr1 mutants in SI for dot sizes of 2.0, 4.0, and 8.0 mm at 14 dpf. N = 3 experiments, n = 75 animals *p < 0.05, HSD, wt (+/+, white), het (+/−, light gray), mut (−/−, dark gray). C, egr1 mutants exhibited social deficits at 16 and 18 dpf, shown for optimal dot size 4.0 mm (dot size with highest SI response). N = 3 experiments, n = 129 animals, and N = 3 experiments, n = 97 animals, *p < 0.05, HSD. Plots of average speed in pixels per second (D) and thigmotaxis index (E) during biological-motion based assays at 4.0 mm dot size revealed no general behavioral deficits for egr1 mutants. N = 3 experiments, n = 77 animals. F, Mutant predator avoidance responses were not significantly different from het and wt siblings across various stimulus sizes at 14 dpf. N = 3 experiments, n = 126 animals. G, Correlation plot of size (in pixels) and SI for 4 mm dot size at 14 dpf. N = 3 experiments, n = 75 animals. H, The differences in SI for 4.0 mm dot size in 14 and 16 dpf larvae (normalized to average 14 dpf wt SI) between mutants and wt/hets (+, white) are significant in both regular-sized and stunted larvae. n = 201 animals, *p < 0.05, HSD. Error bars are SEM. Animal numbers are presented on bars.

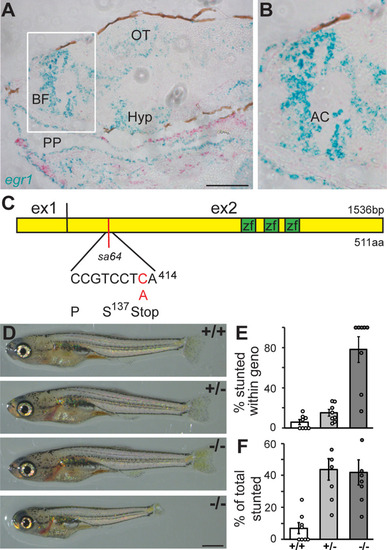
Egr1 is necessary for TH2 expression. A, Western blotting of larval head homogenates at 14 dpf reveals a reduction in expression of TH2 in egr1 mutants. A’, Two color labeling of a Western blotting to highlight in-lane normalization to β-actin and technical replicates. B–E, Western blot intensities in A, A’ were first normalized to in-lane β-actin, and then to wt average intensity. N = 4 experiments, n = 2 technical replicates, *p < 0.05, HSD. F, Immunolabeling of synapses with antibodies to Synapsin 1 and 2 (Syn1/2, magenta) and Gephyrin (Geph, green) in the anterior commissure (AC), lateral view. Insets are magnifications of the cyan box. Scale bar: 5 μm. G, Quantification of synaptic puncta revealed no changes in synapse density in the medial and lateral AC. n ≥ 5 brains per genotype. wt (+/+, white), het (+/−, light gray), mut (−/−, dark gray). Error bars are SEM.

Egr1 is necessary for TH-positive neuron number in BF. A–A’’, Dorsal view of maximum projection of the BF region (magenta box in E) of Et y321 larval zebrafish at 14 dpf labeled with antibodies to GFP (green) and TH (magenta). Anterior commissure (AC); anterior is to the top. B–D, Maximum projections of TH labeling in the BF region posterior to the AC for egr1 wt (B), hets (C) and mutants (D). Scale bars: 30 μm. E, Diagrammatic side-view of the larval brain highlighting the regions (magenta and cyan) analyzed as a maximum projection Z-stacks in A, B–D, respectively. F, Quantification of the number of TH-positive neurons in the cyan region in E revealed a decrease in egr1 mutants at 14 dpf. N = 2 experiments, n = 18 brains, p < 0.05 (HSD). G, The same quantification as in F at 7 dpf demonstrates a consistent decrease in TH-positive neurons during development. N = 2, n = 24, p < 0.05 (HSD). wt (+/+, white), het (+/−, light gray), mut (−/−, dark gray). Error bars are SEM.

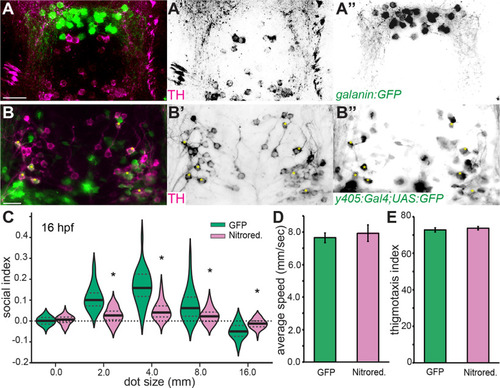
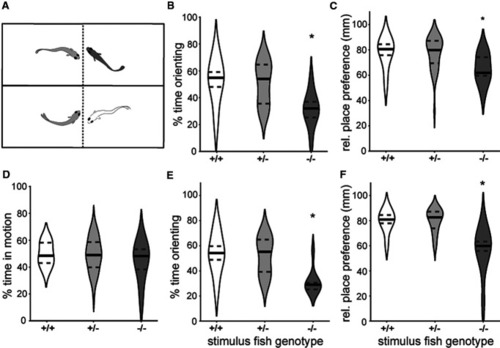
TH-positive neurons in PPa are necessary for social behavior. A–A’’, Maximum projection of the PPa of 14 dpf Tg(galanin:GFP) larvae immunolabeled for GFP (green) and TH (magenta) revealed two distinct populations. Dorsal view of cyan box in Figure 5E, anterior to the top. B–B’’, Maximum projection of PPa of 14 dpf Et y405 larvae immunolabeled for GFP (green) and TH (magenta) revealed transgene expression in ∼30% of TH-positive neurons (yellow asterisks). Scale bars: 20 μm. C, Violin plots of SI for Et y405 larvae with nitroreductase-ablated neurons at 16 dpf (magenta) revealed significant differences compared with control larvae only expressing GFP (green). Both groups were treated with nifurpirinol. N = 2 experiments, n = 60 animals, *p < 0.001, t test comparisons to GFP control. Plots of average speed in pixels per second (D) and thigmotaxis index (E) during biological-motion based assays at 4.0 mm dot size revealed no general behavioral deficits for larvae with Et y405 neurons ablated. N = 2 experiments, n = 60 animals, p > 0.5. Error bars are SEM.

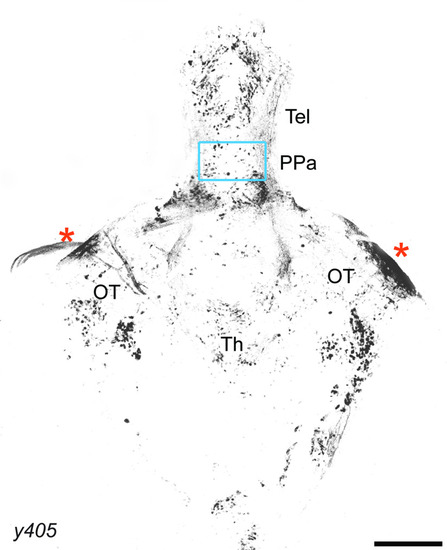
Whole-brain expression of Et y405 at 16 dpf. Maximum Z projection of Et y405 (y405) brain expressing GFP, with the region of interest from Figure 6B marked with a cyan box. Anterior to the top; * nonspecific labeling of meninges. Tel, telencephalon; PPa, anterior parvocellular POA; OT, optic tectum; Th, thalamus. Scale bar: 200 μm.

Acknowledgments
This image is the copyrighted work of the attributed author or publisher, and ZFIN has permission only to display this image to its users. Additional permissions should be obtained from the applicable author or publisher of the image. Full text @ eNeuro