FIGURE SUMMARY
Title

Basement membrane defects in CD151-associated glomerular disease

Authors
Naylor, R.W., Watson, E., Williamson, S., Preston, R., Davenport, J.B., Thornton, N., Lowe, M., Williams, M., Lennon, R.
Source
Full text @ Pediatr. Nephrol.

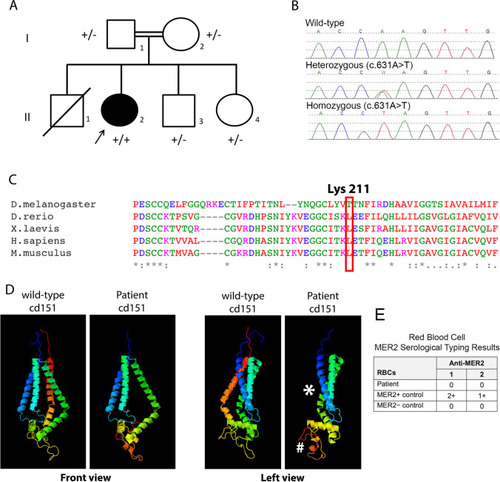
Pedigree, genetic sequence, conservation, protein structure. A) Pedigree of a family affected with nephropathy, nail dysplasia and skin lesions and a CD151 variant. Solid symbols represent affected individuals. The index patient is marked with an arrow.  +/- denotes a heterozygote, + / + denotes a homozygous pathogenic variant. B) Chromatograms of DNA Sanger sequencing reads from affected individuals. DNA was available for testing for all individuals except II1. C) The variant introduces a premature stop codon at Lysine 211. Here, conservation of this lysine is shown across various species. D) Structural modelling of the Lys211* variant effect on CD151 protein using the Phyre2 web portal for protein modelling [15]. Asterisk shows position of missing C-terminal transmembrane helix, hashtag highlights the EC2 loop domain that has grossly changed structure when compared to the wild-type CD151 protein. E) Table showing results of blood serology typing. The patient’s RBCs were found to be negative with two examples of anti-MER2, thereby indicating the MER2-negative phenotype

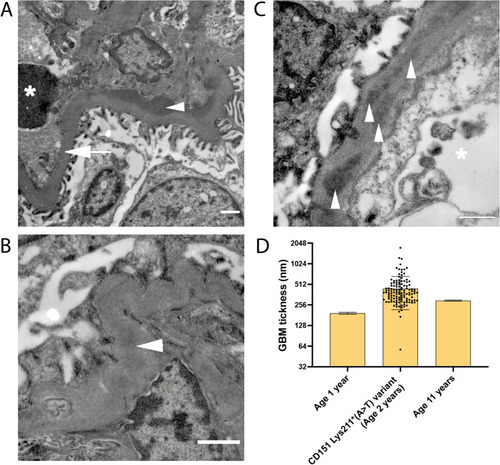
TEM images showing changes in GBM in patient with loss of function variant in the CD151 gene. A) Thickened region of GBM (arrow) opposite to the capillary lumen containing an erythrocyte (asterisk). Electron dense deposits can be seen in the GBM para-mesangial region (arrowhead). B) Wrinkling of GBM around mesangial regions was observed along with electron-dense deposits (arrowhead). C) Smaller electron dense deposits (arrowheads) within the subepithelial region of the GBM (asterisk: capillary lumen). Scale bars = 1 µm. D) quantification of patient GBM thickness based on TEM images of the case patient kidney biopsy and previously published measurements of GBM thickness in a one- and 11-year-old extrapolated from Ramage et al. (2002). Measurements were taken in Fiji/ImageJ, and mean ± SD was calculated in GraphPad Prism

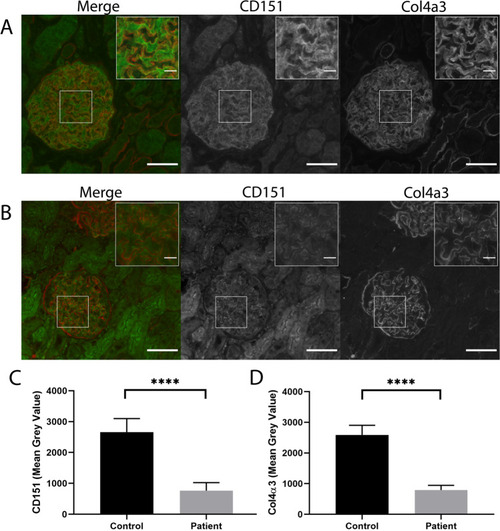
Immunofluorescence images of CD151 and Col4α3 in normal human kidney glomeruli and a patient with loss of function variant in the
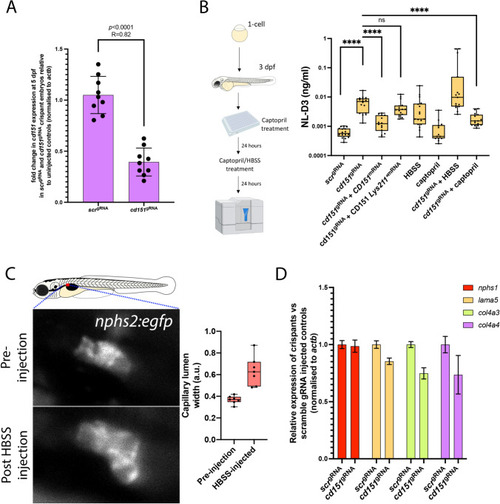
 CD151 gene. IF images left to right: co-IF (CD151 green; Col4α3 red), CD151 and Col4α3. Scale bars = 50 µm, insert scale bar = 10 µm. A) Representative glomeruli from normal human adult control; B) representative glomeruli from patient kidney biopsy – fluorescence was significantly less than control and was adjusted using Fiji/ImageJ to make easily visible; C) quantification of CD151 expression in control and patient glomeruli; D) quantification of Col4α3 expression in control and patient glomeruli. Mean grey values were obtained for the region of the capillary tuft using Fiji/ImageJ and the mean ± SD and an unpaired t-test (p < 0.0001) was performed using GraphPad Prism. Control glomeruli n = 26; Patient glomeruli n  = 17

Depletion of cd151 in zebrafish recapitulates human phenotypes. A) Histogram shows RT-PCR for scrambled gRNA-injected controls and cd151 gRNA-injected crispants. Each data point is a biological replicate (n = 9), and relative expression is to un-injected wild-type controls. All Ct values were normalised to actb expression. B) Schematic on left shows experimental set-up for zebrafish proteinuria analysis. Histogram shows the levels of proteinuria (in relative luminescence units (RLUs)) of the indicated treatments. C) Top panel shows a normal glomerulus in a 3 dpf nphs2:egfp zebrafish embryo. Bottom panel shows the same embryo with a dilated glomerulus 1 h after HBSS injection into the cardiac cavity. Histogram illustrates the measurements of capillary width in the glomeruli of embryos pre- and post-HBSS injection. D) Histogram of RT-PCR results showing the relative gene expression of the indicated genes in cd151 crispant embryos compared to stage-matched controls. All gene expression data were normalised to actb

Acknowledgments
This image is the copyrighted work of the attributed author or publisher, and ZFIN has permission only to display this image to its users. Additional permissions should be obtained from the applicable author or publisher of the image. Full text @ Pediatr. Nephrol.