
- Title
-
Adhesion G protein-coupled receptor Gpr126/Adgrg6 is essential for placental development
- Authors
- Torregrosa-Carrión, R., Piñeiro-Sabarís, R., Siguero-Álvarez, M., Grego-Bessa, J., Luna-Zurita, L., Fernandes, V.S., MacGrogan, D., Stainier, D.Y.R., de la Pompa, J.L.
- Source
- Full text @ Sci Adv
Defective chamber development in Gpr126Δ7/Δ7 mutant embryos is not associated with altered patterning or proliferation.
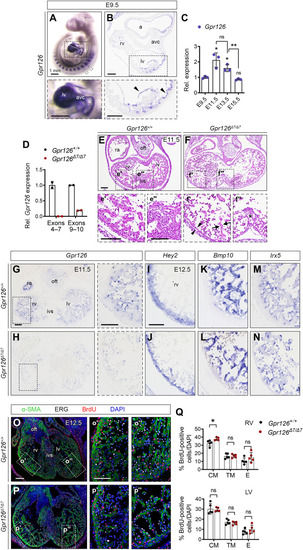
(A) E9.5 WT embryo. Whole-mount in situ hybridization (WISH) showing Gpr126 mRNA in somites (arrowheads) and heart (bottom). (B) Transverse heart sections. Bottom: Arrowheads indicate endocardial Gpr126 expression. (C) Quantitative reverse transcription polymerase chain reaction (qRT-PCR): Gpr126 transcription (relative to Gapdh) in embryonic WT hearts. Data are means ± SD (n = 3 pools of three hearts per pool per stage). Relative values normalized to E9.5. Statistics: Unpaired Student’s t test (ns, not significant; *P < 0.05; **P < 0.01). (D) qRT-PCR. Gpr126 gene expression (relative to Gapdh) in Gpr126 +/+ and Gpr126Δ7/Δ7 E12.5 hearts, using primers spanning exons 4 to 7 and exons 9 and 10. Data are means ± SD (n = 2 hearts). (E to F″) Hematoxylin and eosin (H&E)–stained E11.5 Gpr126+/+ (E to E″) and Gpr126Δ7/Δ7 heart sections (F to F″). Bottom panels: High magnifications of chamber (′) and septum (″). Note compact myocardium (arrowheads) and trabeculae (arrows) thinning and poorly cellularized ventricular septum (asterisk) in the mutant (F′ and F″). (G and H) Gpr126 ISH, E11.5 Gpr126+/+ (G) and Gpr126Δ7/Δ7 (H) heart sections. Right: Higher magnifications. (I to N) ISH of compact myocardium [Hey2 (I and J)], trabecular myocardium [Bmp10 (K and L)], and chamber endocardium [Irx5 (M and N)] markers in E12.5 Gpr126+/+ and Gpr126Δ7/Δ7 hearts. (O to P″) BrdU immunostaining (red) of E12.5 Gpr126+/+ (O to O″) and Gpr126Δ7/Δ7 (P to P″) hearts. α-Smooth muscle actin (α-SMA) (green) counterstains the myocardium, ERG (white) counterstains the endocardium, and 4′,6-diamidino-2-phenylindole (DAPI) (blue) counterstains the nuclei. The panels (′ and ″) show high magnifications of boxed areas in (O) and (P). (Q) BrdU-positive nuclei quantification as a percentage of total nuclei (DAPI+) in the compact (CM), trabecular myocardium (TM), and endocardium (E) of E12.5 Gpr126+/+ and Gpr126Δ7/Δ7 hearts. Data are means ± SD. Statistics: Unpaired Student’s t test. Scale bars, 100 μm (low magnification) and 50 μm (high magnification). a, atrium; avc, atrioventricular canal; ivs, interventricular septum; la, left atrium; lv, left ventricle; oft, outflow tract; ra, right atrium; rv, right ventricle. |

Conditional Gpr126 deletion in either the endocardium or all cardiac tissues allows embryonic survival.
(A to D″) H&E staining of transverse heart sections from WT (A to A″), Gpr126fl/fl;Nfatc1Cre/+ (B to B″), Gpr126fl/fl;Tie2Cre/+ (C to C″), and Gpr126fl/fl;Mesp1Cre/+ (D to D″) embryos at E15.5. Magnified views of the right ventricle are shown in (′) and of the left ventricle in (″). (E) qRT-PCR analysis showing relative Gpr126 gene expression (to Gapdh) in Gpr126fl/fl;Mesp1+/+ and Gpr126fl/fl;Mesp1Cre/+ embryonic hearts at E12.5 using primers spanning exons 4 to 7 and exons 9 and 10. Data are means ± SD (n = 3 embryonic hearts); t test, *P < 0.05 and ***P < 0.001. (F to H) H&E staining of transverse heart sections from WT Gpr126fl/Δ7 (F), Gpr126fl/Δ7;Tie2Cre/+ (G), and Gpr126fl/Δ7;Mesp1Cre/+ (H) embryos at E16.5. Left panels: Right ventricle; Right panels: Left ventricle. (I) Schematic of the conditional gain-of-function R26-GPR126GOF construct. GPR126 expression is activated upon the Cre-mediated excision of the NeoR-STOP cassette. (J) Top panels: Confocal images showing eGFP expression in E9.5 GPR126GOF/+ and GPR126GOF/+;Nkx2.5Cre/+ hearts. Bottom panels: WISH showing GPR126 expression in E9.5 GPR126GOF/+ and GPR126GOF/+;Nkx2.5Cre/+ hearts. (K) Representation of GPR126GOF/+;Gpr126Δ7/Δ7;Tie2Cre/+ embryos from crosses of Gpr126Δ7/+;Tie2Cre/+ males with GPR126GOF/+;Gpr126Δ7/+ females. Scale bars, 100 μm. GFP, green fluorescent protein; IRES, internal ribosome entry site; mv, mitral valve; neoR, neomycin resistance gene; R26 pr, Rosa26 promoter; tv, tricuspid valve. |

Trabeculation is unaffected in gpr126bns341 and gpr126bns342 zebrafish mutants.
(A and B) RT-qPCR analysis of relative gpr126 and gpr112a mRNA expression (to the housekeeping gene rpl13a) in WT zebrafish and heterozygous and homozygous gpr126bns341 (A) and gpr126bns342 (B) zebrafish mutants at 48 hours postfertilization (hpf). Data are means ± SD (n = 1, 2, or 3 pools of three hearts per pool). (C to E) Lateral views of 100 hpf gpr126+/+ (E), gpr126bns341/bns341 (D), and gpr126bns342/bns342 (E) zebrafish larvae. Inset panels: High-magnification views of the heart (boxed area). (F to I) Mid-sagittal confocal sections of gpr126+/+ and gpr126bns342/bns342 zebrafish hearts at 80 hpf (F and G) and 96 hpf (H and I) in larvae derived from gpr126bns342/+;Tg(kdrl:Hsa.HRAS-mCherry);Tg(myl7:EGFP-Hsa.HRAS) incrosses. (J and K) Mid-sagittal confocal sections of gpr126+/+ and gpr126bns341/bns341 zebrafish hearts at 96 hpf in larvae derived from gpr126bns341/+;Tg(myl7:EGFP-Hsa.HRAS) incrosses. Endocardial and myocardial membranes in (F) to (K) are labeled red and green, respectively. Right panels: High-magnification views of the outer curvature of the ventricular wall corresponding to the boxed areas. Arrowheads indicate emerging trabeculae. Scale bars, 25 μm. bv, bulboventricular valve; v, ventricle. EXPRESSION / LABELING:
PHENOTYPE:
|

Gpr126 is expressed in the mouse placenta and controls the expression of Spa-TGC markers.
(A and B) Cartoon illustrating the main tissue layers (A) and cell types (B) of a WT E12.5 mouse placenta and key marker genes that are expressed in each cell type. Note that family members of the trophoblast giant cell–expressed Prl (prolactin/placental lactogen/prolactin-like protein) genes are also known as follows: Prl3d1 = Pl1, Prl3b1 = Pl2, Prl2c2 = Plf, Prl8a2 = Dtprp, Prl7b1 = PlpN. (C to H⁗) H&E staining (C to C‴, E to E‴, and G to G⁗) and ISH analysis (D to D‴, F to F‴, and H to H⁗) of Gpr126 on sagittal sections of E9.5, E10.5, and E11.5 WT placentas. Right panels (′, ″, ‴, and ⁗): High-magnification views of the boxed areas, showing the spiral artery-associated trophoblast giant cells (Spa-TGCs) (′, with gene expression marked with black triangular arrowheads), parietal TGCs (P-TGCs) (″, with gene expression marked with black arrows, except for the white arrow in h’’ that points to the SpT), sinusoidal TGCs (S-TGCs) (‴, with gene expression marked with black notched arrowheads), and canal TGCs (C-TGCs) (⁗, with gene expression marked with white notched arrowheads). Scale bars, 200 μm (low magnification); 50 μm (insets). (I) qRT-PCR showing relative gene expression of key markers shown in (A and B) in E11.5 Gpr126+/+ and Gpr126Δ7/Δ7 placentas. β-Actin was used as a housekeeping gene. Data are means ± SD (n = 3 WT and 3 mutant placentas and 4 WT and 4 mutant placentas for Mmp9 expression analysis). Statistical significance was determined by unpaired Student’s t test (*P < 0.05; **P < 0.01; ***P < 0.001). GlyT, Glycogen trophoblast cell; JZ, junctional zone; SpT, spongiotrophoblast. |

Dissection of embryonic and trophoblast-induced effects of Gpr126 mutation.
(A) Representation of the embryonic and extraembryonic genetic constitution of Gpr126fl/fl;Sox2Cre embryos when the Sox2Cre transgene is inherited paternally. Zygotic Sox2Cre expression deletes Gpr126 in the embryo proper and in the embryonic component of the placenta (white). Gpr126 is not inactivated in the maternal component of the placenta (pink). (B) Images of Gpr126KO/fl and Gpr126KO/fl;Sox2Cre mouse pups at P1. Arrowheads point to joint contractures in the forelimbs and hindlimbs of the mutants. (C to F″) H&E staining of transverse heart sections from Gpr126KO/fl and Gpr126KO/fl;Sox2Cre mutant embryos at E16.5 (C to D″) and P1 (E to F″). Bottom panels: High-magnification views of the right ventricle (′) and left ventricle (″) corresponding to the boxed areas in the main panels. Scale bars, 100 μm. (G) Representation of the embryonic and extraembryonic genetic constitution of Gpr126fl/fl;Sox2Cre embryos when the Sox2Cre transgene is inherited maternally. Note Gpr126 inactivation in both the embryo proper and in the placenta. (H) Breeding strategy used to obtain GPR126GOF/+;Gpr126Δ7/Δ7;Sox2Cre/+ embryos. The parental origin of the Cre transgene determines whether forced GPR126GOF expression (green) will take place only in the epiblast (paternal inheritance) or will be widespread in embryonic and extraembryonic tissues (maternal inheritance). |

Gpr126Δ7/Δ7 mutant placentas show defective maternal spiral arteries remodeling and aberrant organization of maternal sinusoids in the labyrinth.
(A to B″) E11.5 Gpr126+/+ (A) and Gpr126Δ7/Δ7 (B) sagittal placental section immunostainings. Endomucin (white) labels maternal endothelial cells in the decidua basalis (DB) and fetal endothelial cells in the labyrinth (L); pan-cytokeratin (green) marks trophoblasts in DB, JZ, and L; α-SMA (red) detects unremodeled spiral arteries in DB and maternal canals in L. Sections were DAPI counterstained (blue). The yellow dotted lines delineate the borders of JZ with DB and L. (A′, A″, B′, and B″) High magnifications corresponding to boxed areas. Arrowheads in (A′) indicate pan-cytokeratin–positive trophoblasts in JZ; arrows in (A″) mark trophoblasts surrounding maternal spiral arteries in the proximal DB; asterisks in (B′ and B″) indicate reduced pan-cytokeratin expression. (C to D′) E12.5 Gpr126+/+ (C) and Gpr126Δ7/Δ7 (D) sagittal placental sections. Endomucin immunostaining (green) in fetal endothelial cells of L. The white dotted lines delineate the JZ and L border. Boxed regions (C and D) are magnified in (′). (E to F′) ALP staining on E11.5 Gpr126+/+ (E) and Gpr126Δ7/Δ7 (F) sagittal placental sections. Maternal blood sinusoids in L are detected by ALP activity of the syncytiotrophoblast layer. Black dotted lines delineate the JZ and L border. Boxed regions (E and F) are magnified in (′). (G) Quantification of fetal vessel area in relation to total placental L area in E12.5 Gpr126+/+ and Gpr126Δ7/Δ7 placentas. Data are means ± SD (n = 5 Gpr126+/+ and 4 Gpr126Δ7/Δ7 placentas). Statistical significance: Unpaired Student’s t test. (H) Quantification of maternal sinusoid area in L of E11.5 Gpr126+/+and Gpr126Δ7/Δ7 placentas: Sinusoids are larger in mutant placentas. Data are means ± SD (n = 3 Gpr126+/+ and 3 Gpr126Δ7/Δ7 placentas). Statistical significance: unpaired Student’s t test (*P < 0.05). Scale bars, 100 μm; otherwise, it is indicated. |
Model of Gpr126 function in the remodeling of the maternal vasculature of the mouse placenta.
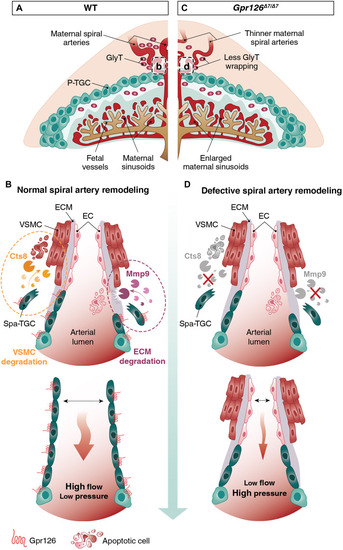
(A to D) Illustrations of an E12.5 WT (A) and a Gpr126Δ7/Δ7 (C) placenta. In a WT placenta (A and B), Gpr126 endows TGCs with invasive behavior by regulating the production of Mmp9, together with the capacity to degrade vascular smooth muscle cells through the expression of Cts8. Both activities are required for uterine trophoblast invasion and vascular remodeling during placental development, through which Spa-TGCs replace the maternal endothelial lining and GlyTs congregate around spiral arteries, transforming the maternal spiral arteries from narrow high-resistance, low-flow vessels into dilated vessels, allowing higher blood flow at lower pressure. The Gpr126-null placentas (C and D) fail to express Mmp9 and Cts8, thus impairing trophoblast migration and spiral artery adaptation. Fewer GlyTs wrapped around the unremodeled maternal spiral arteries. As a result of the altered uteroplacental hemodynamics, increased blood pressure triggers an enlargement of the maternal sinusoids. EC, endothelial cell; ECM, extracellular matrix; GlyT, glycogen trophoblasts; VSMC, vascular smooth muscle cell. |