
- Title
-
Simultaneous imaging of calcium and contraction in the beating heart of zebrafish larvae
- Authors
- Salgado-Almario, J., Vicente, M., Molina, Y., Martinez-Sielva, A., Vincent, P., Domingo, B., Llopis, J.
- Source
- Full text @ Theranostics
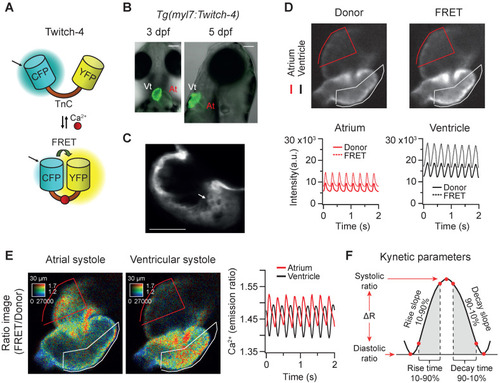
In vivo recording of Ca2+ dynamics in the beating heart of Tg(myl7:Twitch-4) zebrafish larvae. (A) Schematic structure of the Ca2+ biosensor Twitch-4 and its principle of action (FRET, Förster resonance energy transfer). (B) Overlay of transmitted light and fluorescence images of 3 and 5 dpf larvae showing the ventral and lateral orientation of the heart after mounting (At - atrium, Vt - ventricle). The scale bar represents 100 μm. (C) Confocal image of a 3 dpf larva showing the cytoplasmatic localization of Twitch-4 in the cardiomyocytes. The scale bar represents 50 μm. (D) Fluorescence intensity images of the donor and FRET channels of a 3 dpf larva heart in ventricular systole. Regions-of-interest (ROI) were manually drawn on the atrium and ventricle and their mean pixel value was obtained at each timepoint. The traces show the time course of fluorescence intensity of the donor and FRET channels. (E) Emission ratio images (FRET image/donor image) in pseudo color of atrial and ventricular systoles in a 3 dpf larva. The calibration squares show the distance in µm, whereas the hue codes for the emission ratio and intensity codes for the fluorescence intensity. The traces show the atrial and ventricular Ca2+ levels (emission ratios) over time. (F) Kinetic parameters calculated from the ratio time course data (see Methods for their definition). |
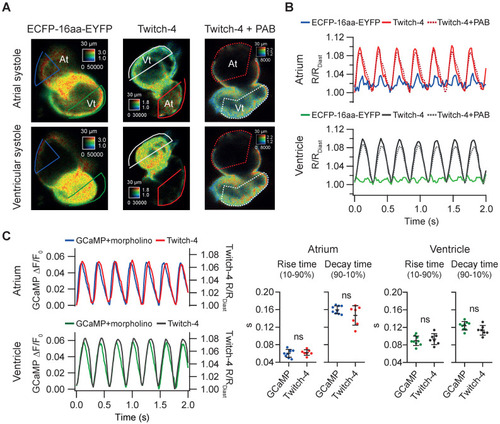
Tg(myl7:Twitch-4) reports cardiac Ca2+ oscillations and corrects motion artifacts in 3 dpf larvae. (A) Emission ratio images of Tg(myl7:ECFP-16aa-EYFP) and Tg(myl7:Twitch-4) moving hearts, and Tg(myl7:Twitch-4) heart stopped with 75 µM para-amino blebbistatin (PAB) (representative experiments). The atrial (At) and ventricular (Vt) systoles are shown. (B) Normalized emission ratio traces over time (R/RDiast) calculated from larvae in A. The lowest diastolic ratio value (RDiast) in each register was used for normalization. (C) Representative atrial and ventricular Ca2+ transients of a Tg(myl7:GCaMP)s878 non-contracting heart (tnnt2a mopholinos) and a Tg(myl7:Twitch-4) beating heart. The plots show the rise and decay times of the atrial and ventricular Ca2+ transients (n = 9 larvae for Tg(myl7:GCaMP)s878 from N = 2 experiments, and n = 7 for Tg(myl7:Twitch-4) from N = 5 experiments). Data are shown as the mean ± SD. A two-tailed unpaired Student's t-test was used. |
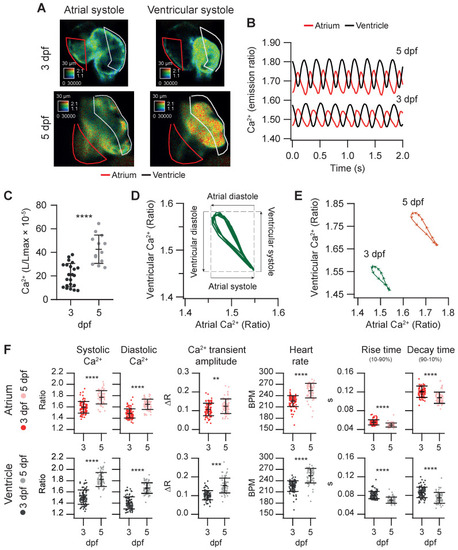
Basal cardiac Ca2+ kinetics of 3 and 5 dpf zebrafish larvae. (A) Emission ratio images of atrial and ventricular systoles of 3 and 5 dpf Tg(myl7:Twitch-4) representative larvae. (B) Atrial and ventricular Ca2+ levels (emission ratio) over time calculated from larvae in A. (C) Ventricular Ca2+ levels (L/Lmax) of 3 (n = 22, N = 8) and 5 dpf (n = 13, N = 5) Tg(myl7:GFP-Aequorin) larvae measured with a luminescence method. (D) Lissajous diagrams of the ventricular vs. atrial Ca2+ in several cardiac cycles from the 3 dpf larva traces in B. The arrows indicate the phases of the cardiac cycle. (E) Diagrams of the ventricular vs. atrial Ca2+ levels of the 3 and 5 dpf larvae in B (one cardiac cycle). The distance between arrowheads in these loops represents 20 ms, showing the direction of time and the relative speed of each phase. (F) Kinetic parameters extracted from atrial and ventricular Ca2+ traces of 3 (n = 100, N = 12) and 5 dpf (n =68, N = 7) Tg(myl7:Twitch-4) larvae (see Methods for parameter definition). Statistical analysis was performed as indicated in Supplementary data 1. Data are shown as mean ± SD (*** p < 0.001, **** p < 0.0001). |
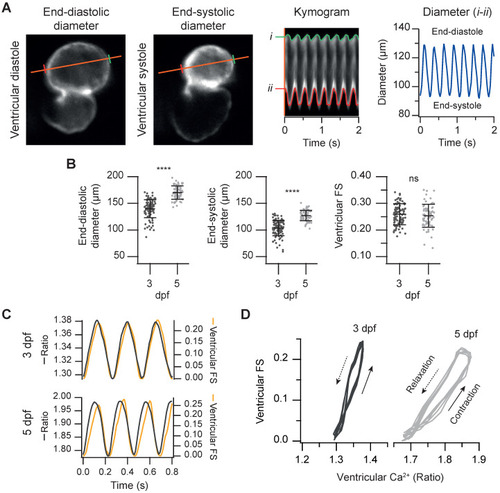
Simultaneous measurement of the ventricular Ca2+ levels and contractile function in 3 and 5 dpf zebrafish larvae. (A) FRET channel images of a representative 3 dpf Tg(myl7:Twitch-4) larva showing end-systolic and end-diastolic ventricular diameters. The kymogram displays the changes of diameter along time (the distance between red and green lines). The trace shows the ventricular diameter extracted from the kymogram. (B) Ventricular end-diastolic and end-systolic diameters, and the ventricular FS of 3 (n = 100, N = 12) and 5 dpf (n = 68, N = 7) Tg(myl7:Twitch-4) larvae. Data are shown as mean ± SD. Statistical analysis was performed as indicated in Supplementary data 1 (**** p < 0.0001). (C) FS and ventricular Ca2+ changes of representative 3 and 5 dpf Tg(myl7:Twitch-4) larvae over time. (D) Diagrams of the ventricular FS vs. ventricular Ca2+ level of the larvae in C during several cardiac cycles. The arrows indicate the direction of time. |
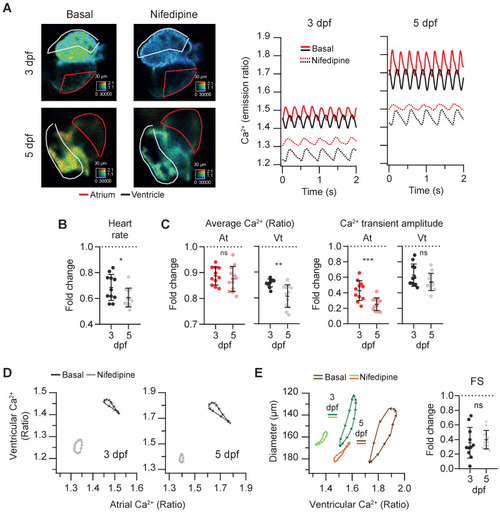
Effect of the L-type Ca2+ channel blocker nifedipine on cardiac Ca2+ levels and ventricular shortening of 3 and 5 dpf zebrafish larvae. Tg(myl7:Twitch-4) larvae at 3 (n = 11, N = 4) and 5 dpf (n = 12, N = 4) were treated with 100 µM nifedipine for 1 h. (A) Emission ratio images of a ventricular systole of representative larvae before (basal) and after the incubation with nifedipine. The traces show the atrial (red) and ventricular (black) Ca2+ levels (emission ratio) of these larvae. (B) Fold change over the basal HR of larvae treated with nifedipine. (C) Fold change of the average Ca2+ levels and amplitude of Ca2+ transients over their basal values in the atrium (At) and ventricle (Vt) (D) Diagrams of the ventricular vs. atrial Ca2+ levels (one cardiac cycle) of representative larvae before (basal) and after the incubation with nifedipine (note the different scale for 3 and 5 dpf). (E) Diagrams of the ventricular diameter vs. ventricular Ca2+ level (one cardiac cycle) of representative larvae before (basal) and after addition of nifedipine. The plot shows the fold change over the basal FS. All data are shown as the mean ± SD. A two-tailed unpaired Student's t-test was used (* p < 0.05, ** p < 0.01, *** p < 0.001). |
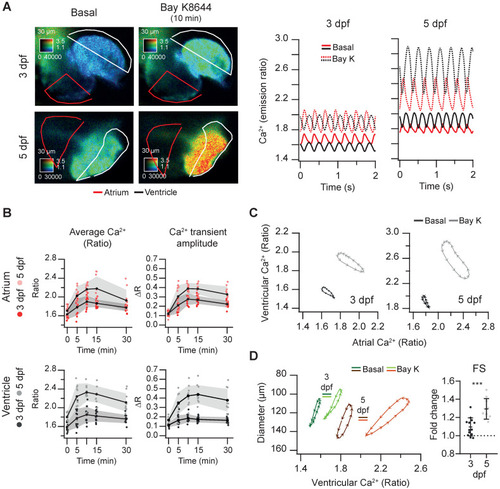
Effect of the L-type Ca2+ channel activator Bay K8644 on cardiac Ca2+ levels and ventricular shortening of 3 and 5 dpf zebrafish larvae. Tg(myl7:Twitch-4) larvae at 3 (n = 13, N = 3) and 5 dpf (n = 10, N = 3) were treated with 100 µM Bay K8644. (A) Emission ratio images of a ventricular systole of representative larvae before (basal) and after 10 min incubation with Bay K8644. The traces show their atrial (red) and ventricular (black) Ca2+ levels (emission ratio). (B) Effect of Bay K8644 on the average Ca2+ levels and Ca2+ transient amplitude in the atrium and ventricle. Data are shown as the mean (black line) ± SD (gray stripe). (C) Diagrams of the ventricular vs. atrial Ca2+ levels (one cardiac cycle) of representative larvae before (basal) and after 10 min incubation with Bay K8644. (D) Diagrams of the ventricular diameter vs. ventricular Ca2+ level (one cardiac cycle) of representative larvae before (basal) and after 10 min incubation with Bay K8644. The plot shows the fold change over the basal FS of larvae treated with Bay K8644 for 10 min. A two-tailed unpaired Student's t-test was used (*** p < 0.001). |
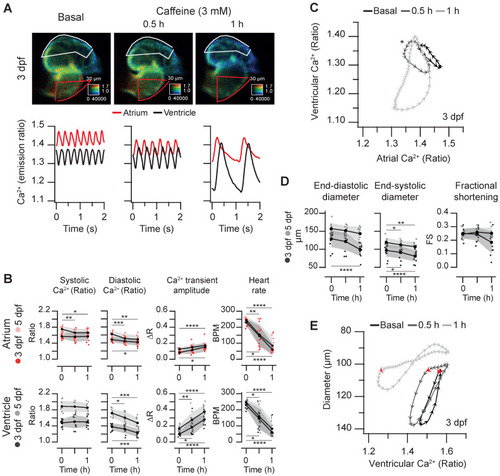
Effect of caffeine on cardiac Ca2+ levels and ventricular shortening in 3 and 5 dpf zebrafish larvae. Tg(myl7:Twitch-4) larvae at 3 (n = 12, N = 3) and 5 dpf (n = 11, N = 4) were treated with 3 mM caffeine. (A) Emission ratio images of ventricular diastoles of a representative larva before (basal) and after 0.5 and 1 h incubation with caffeine (representative experiment). The traces show the corresponding atrial and ventricular Ca2+ levels (emission ratio). (B) Systolic and diastolic Ca2+ levels, Ca2+ transient amplitude and heart rate before and after 0.5 and 1 h treatment with caffeine (C) Diagram of the ventricular vs. atrial Ca2+ levels (one cardiac cycle) from the larva in A (3 dpf). (D) Ventricular diameters and FS before and after 0.5 and 1 h incubation with caffeine. (E) Diagram of the ventricular diameter vs. ventricular Ca2+ level (one cardiac cycle) of a representative 3 dpf larva before and after 0.5 and 1 h incubation with caffeine. The red arrows mark the start of the atrial systole and ventricular filling. Data in (B) and (D) are shown as the mean (black line) ± SD (gray stripe). Statistical analysis was performed as indicated in Supplementary data 1 (* p < 0.05; ** p < 0.01; *** p < 0.001, **** p < 0.0001). |

Altered excitation in 3 and 5 dpf zebrafish larvae caused by caffeine. Some Tg(myl7:Twitch-4) larvae treated with 3 mM caffeine showed an altered pattern of atrial and ventricular Ca2+ transients. (A) Atrial and ventricular Ca2+ levels (emission ratio) before (basal) and after 1 h incubation with 3 mM caffeine in 3 and 5 dpf larvae (representative experiments). The vertical dotted lines show that ventricular Ca2+ increased before atrial Ca2+ in the 5 dpf larva. (B) Diagrams of the ventricular vs. atrial Ca2+ levels (one cardiac cycle) of the larvae in A before (basal) and after 1 h incubation with caffeine. (C) Diagrams of the ventricular diameter vs. ventricular Ca2+ level (one cardiac cycle) of the same larvae. The red arrows indicate the start of the atrial systole. Each arrowhead in B and C corresponds to one image: they are separated from each other by 20 ms. |