
Fig. 3
- ID
- ZDB-FIG-230225-4
- Publication
- Salgado-Almario et al., 2022 - Simultaneous imaging of calcium and contraction in the beating heart of zebrafish larvae
- Other Figures
- All Figure Page
- Back to All Figure Page
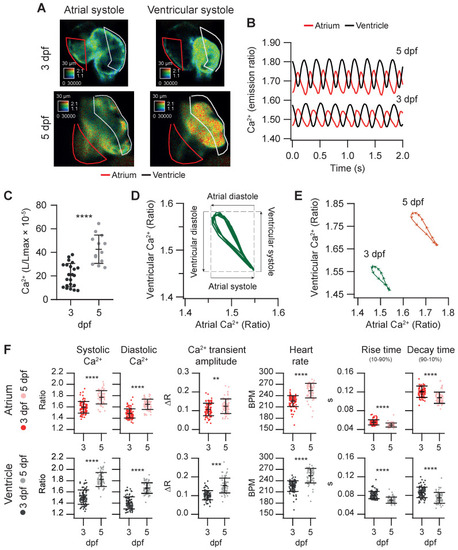
Basal cardiac Ca2+ kinetics of 3 and 5 dpf zebrafish larvae. (A) Emission ratio images of atrial and ventricular systoles of 3 and 5 dpf Tg(myl7:Twitch-4) representative larvae. (B) Atrial and ventricular Ca2+ levels (emission ratio) over time calculated from larvae in A. (C) Ventricular Ca2+ levels (L/Lmax) of 3 (n = 22, N = 8) and 5 dpf (n = 13, N = 5) Tg(myl7:GFP-Aequorin) larvae measured with a luminescence method. (D) Lissajous diagrams of the ventricular vs. atrial Ca2+ in several cardiac cycles from the 3 dpf larva traces in B. The arrows indicate the phases of the cardiac cycle. (E) Diagrams of the ventricular vs. atrial Ca2+ levels of the 3 and 5 dpf larvae in B (one cardiac cycle). The distance between arrowheads in these loops represents 20 ms, showing the direction of time and the relative speed of each phase. (F) Kinetic parameters extracted from atrial and ventricular Ca2+ traces of 3 (n = 100, N = 12) and 5 dpf (n =68, N = 7) Tg(myl7:Twitch-4) larvae (see Methods for parameter definition). Statistical analysis was performed as indicated in Supplementary data 1. Data are shown as mean ± SD (*** p < 0.001, **** p < 0.0001). |