
|
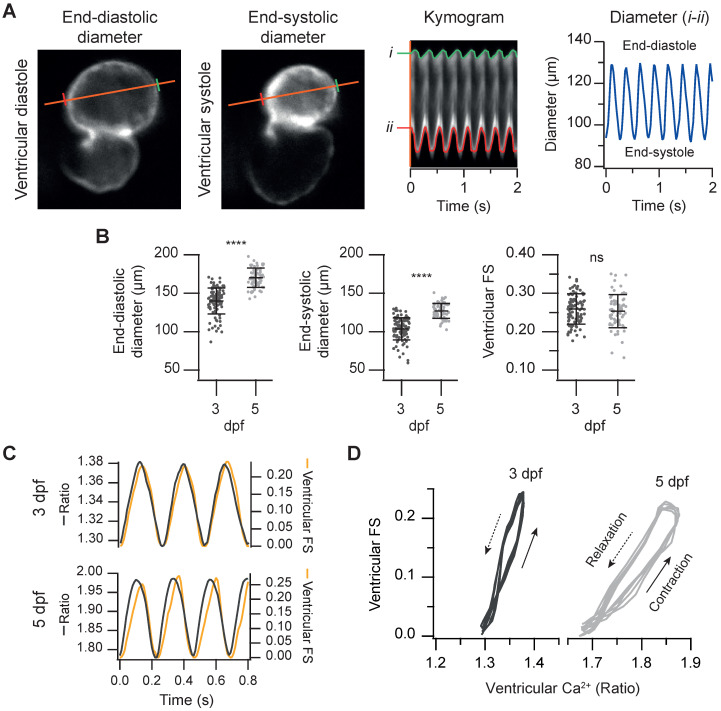
Fig. 4
Simultaneous measurement of the ventricular Ca2+ levels and contractile function in 3 and 5 dpf zebrafish larvae. (A) FRET channel images of a representative 3 dpf Tg(myl7:Twitch-4) larva showing end-systolic and end-diastolic ventricular diameters. The kymogram displays the changes of diameter along time (the distance between red and green lines). The trace shows the ventricular diameter extracted from the kymogram. (B) Ventricular end-diastolic and end-systolic diameters, and the ventricular FS of 3 (n = 100, N = 12) and 5 dpf (n = 68, N = 7) Tg(myl7:Twitch-4) larvae. Data are shown as mean ± SD. Statistical analysis was performed as indicated in Supplementary data 1 (**** p < 0.0001). (C) FS and ventricular Ca2+ changes of representative 3 and 5 dpf Tg(myl7:Twitch-4) larvae over time. (D) Diagrams of the ventricular FS vs. ventricular Ca2+ level of the larvae in C during several cardiac cycles. The arrows indicate the direction of time.