
Fig. 5
- ID
- ZDB-FIG-230225-6
- Publication
- Salgado-Almario et al., 2022 - Simultaneous imaging of calcium and contraction in the beating heart of zebrafish larvae
- Other Figures
- All Figure Page
- Back to All Figure Page
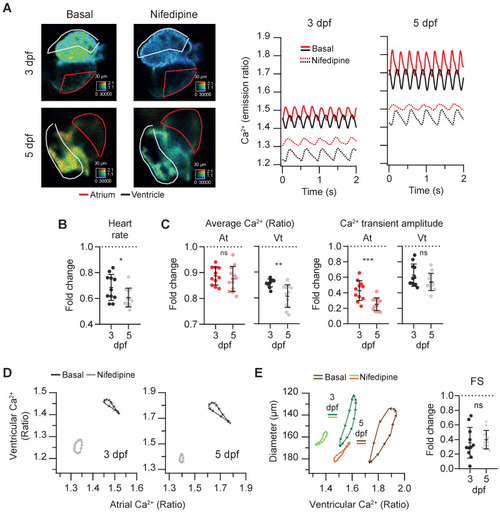
Effect of the L-type Ca2+ channel blocker nifedipine on cardiac Ca2+ levels and ventricular shortening of 3 and 5 dpf zebrafish larvae. Tg(myl7:Twitch-4) larvae at 3 (n = 11, N = 4) and 5 dpf (n = 12, N = 4) were treated with 100 µM nifedipine for 1 h. (A) Emission ratio images of a ventricular systole of representative larvae before (basal) and after the incubation with nifedipine. The traces show the atrial (red) and ventricular (black) Ca2+ levels (emission ratio) of these larvae. (B) Fold change over the basal HR of larvae treated with nifedipine. (C) Fold change of the average Ca2+ levels and amplitude of Ca2+ transients over their basal values in the atrium (At) and ventricle (Vt) (D) Diagrams of the ventricular vs. atrial Ca2+ levels (one cardiac cycle) of representative larvae before (basal) and after the incubation with nifedipine (note the different scale for 3 and 5 dpf). (E) Diagrams of the ventricular diameter vs. ventricular Ca2+ level (one cardiac cycle) of representative larvae before (basal) and after addition of nifedipine. The plot shows the fold change over the basal FS. All data are shown as the mean ± SD. A two-tailed unpaired Student's t-test was used (* p < 0.05, ** p < 0.01, *** p < 0.001). |