
- Title
-
The Novel Human HtrA2 Ortholog in Zebrafish: New Molecular Insight and Challenges into the Imbalance of Homeostasis
- Authors
- Nam, M.K., Moon, J.M., Kim, G.Y., Min Kim, S., Rhim, H.
- Source
- Full text @ Gene
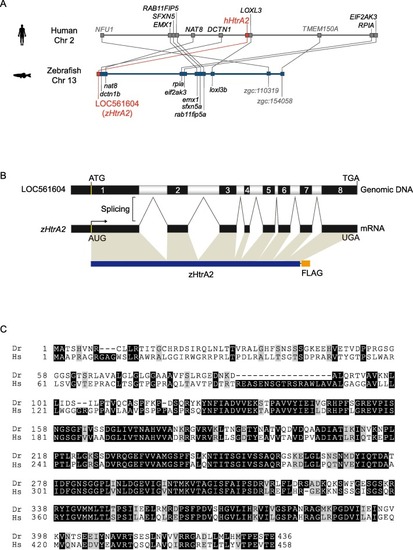
Fig. 1. High structural homology between the zebrafish LOC561604 (zHtrA2) and zHtrA2 protein and the human counterparts. (A) The shared synteny between the chromosomal regions containing the human and zebrafish HtrA2. hHtrA2 and zHtrA2 (red box) are in the order of NAT8 and DCTN1 on the human chromosome (Chr) 2 and nat8 and dctn1b on zebrafish Chr 13, respectively. The orthologous counterparts of the two species are connected by gray lines. (B) A schematic diagram of the LOC561604 gene. Splicing eliminates the introns and joins eight exons (black box) to produce the mRNA. The FLAG epitope tag (yellow box) was cloned into the C-terminus of the plasmid encoding zHtrA2 (AA 1–436). (C) The alignment and the conservation between the amino acid (AA) sequence of HtrA2 proteins. The pairwise alignment of two sequences was performed with the Clustal W program and BoxShade Sever from EMBnet. Black and gray boxes indicate the identical and conservatively altered AAs, respectively. Hs, Homo sapiens and Dr, Danio rerio. |
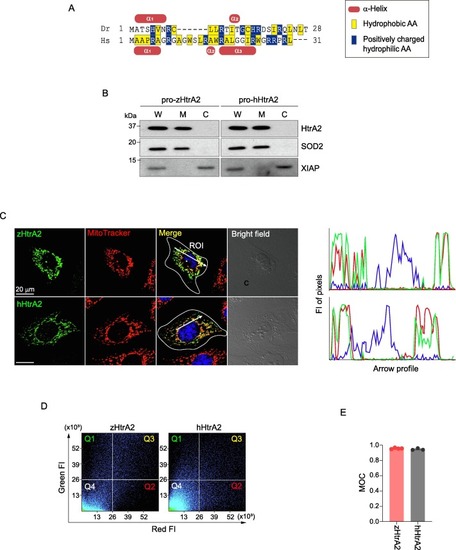
Fig. 2. zHtrA2 is primarily localized in the mitochondria. (A) Alignment of the N-terminal region of pro-HtrA2 proteins. Shown boxes are the AAs classified according to the characteristics of the R groups of each AA. (B) Biochemical determination of the mitochondrial localization of zHtrA2. The HEK293T cells that were transfected to express HtrA2 proteins were lysed. The whole-cell lysates (W) were separated into mitochondrial (M) and cytosolic (C) fractions and probed with antibodies against XIAP and SOD2, which are cytosolic and mitochondrial markers, respectively. (C) Confocal images of the mitochondrial localization of zHtrA2. The HtrA2 (green) was immunostained with FLAG Ab. The mitochondria (red) and nuclei (blue) were stained with MitoTrackerTM Red CMXRos, which accumulates in the mitochondria of live cells upon the mitochondrial membrane potential, and DAPI, respectively. The fluorescence images were taken with a confocal laser scanning microscope (LSM800 w/Airyscan). The region of interest (ROI) in the selected cells was drawn using the Zen software. The graphs on the right panel show the fluorescence intensity (FI, y-axis) of the green, red and blue pixels on the white arrow (x-axis). (D) Scatterplot analysis of the mitochondrial localization of zHtrA2. Each green (HtrA2) and red (mitochondria) pixel in the confocal images were plotted in the scatter diagram. The color of quadrant (Q) corresponds to the pixels with a high FI of the targets, and Q3 represents the pixels with a high FI of both green and red, indicating their colocalization. Q1, high green and low red; Q2, high red and low green; Q4, low green and red. (E) Quantitative validation of the mitochondrial localization of zHtrA2 in single cells. Values are representative of Manders’ Overlap Coefficients (MOC) automatically calculated by the Zen software on scatterplots (d) (n = 3–4 different cells). The data were calculated as means ± standard error of the mean (SEM). |
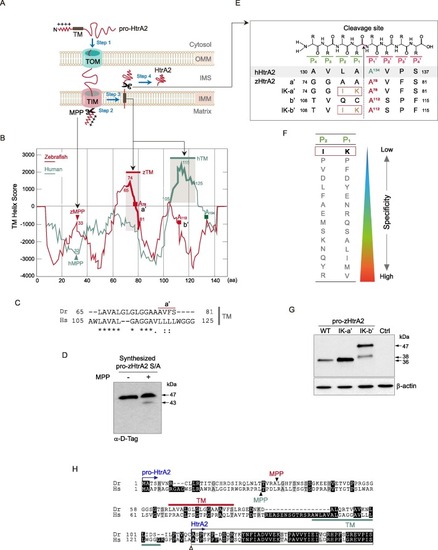
Fig. 3. zHtrA2 is produced via the cleavage of the peptide bond between K111 (P1) and A112 (P1′). (A) Schematic representation of the targeting of HtrA2 to the mitochondrial intermembrane space (IMS). Step 1, Pro-HtrA2 is transported to the mitochondria by the translocase of the outer and inner membranes (TOM and TIM). Step 2, the mitochondrial targeting sequence (MTS) is proteolytically removed by mitochondrial processing peptidase (MPP). Step 3, the transmembrane (TM) domain is inserted laterally into the inner mitochondrial membrane (IMM), where it functions as a hydrophobic anchor. Step 4, HtrA2 is released into the IMS after the proteolytic cleavage on its intermembrane side. (B) The in silico prediction of the putative processing regions in pro-zHtrA2. The TM helix score of pro-HtrA2 was calculated by the TMpred program (prediction of membrane-spanning regions and orientation). The candidate MPP cleavage site (peptide bond between A32 and L33) and the TM segment (AA 65–81) of pro-zHtrA2 were predicted by PSORT II. Red squares indicate the predicted P1′ residues for maturation into zHtrA2 (see Fig. 3E). (C) Conservation of the TM between both pro-HtrA2 proteins. (D) Verification of the proteolytical removal of the MTS by MPP (Step 2 in Fig. 3a). Pro-zHtrA2 S/A was synthesized using the in vitro TNT SP6 protein expression system, incubated with the MPPα/β dimer, and probed with D-Tag Ab. (E) Summary of putative cleavage sites and their mutations in zHtrA2. The cleavage occurs the peptide bond between the P1 and P1′ subsites. Based on A134 at the P1′ subsite of hHtrA2, the A78 (a′) and A112 (b′) in zHtrA2 were predicted to be the P1′ position IK-a′ and IK-b′ denoting the mutants with isoleucine (I) and lysine (K) substitutions at the indicated sites. (F) Illustration of residues with the weakest substrate specificity for the P1 and P2 subsites(Martins et al., 2003). (G) Determination of the cleavage site for the maturation of zHtrA2. The plasmids encoding the indicated pro-zHtrA2 proteins were transfected into HEK293T cells, and the control (Ctrl) cells were transfected with pcDNA3. The proteolytic processed zHtrA2 was analyzed by IB with D-Tag Ab. (H) Summary of sequence alignment of the TM and processing sites for both pro-HtrA2 proteins. Closed and open arrowheads denote the cleavage sites by MPP and for maturation to produce HtrA2, respectively. zHtrA2 starts at residue A112 (see Fig. 3E). |
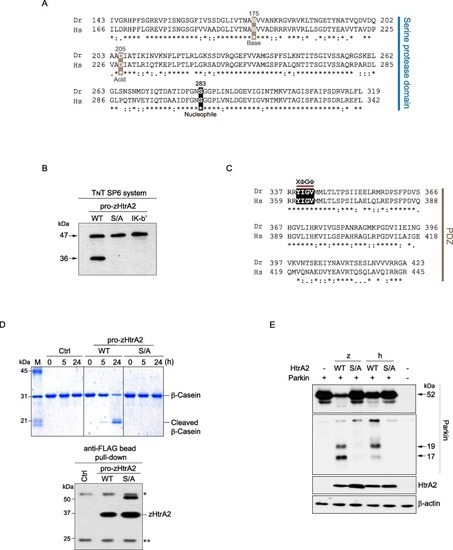
Fig. 4. Enzymatic conservation of zHtrA2 as a serine protease. (A) The sequence alignment for identifying the putative serine protease domain (AA 143–319) of zHtrA2. The catalytic triad residues are indicated by boxes. The corresponding domain of hHtrA2, i.e. residues 166–342, was used as an alignment control. Identical residues (“*”), residues with highly similar properties of the R group (“:”), and residues with weakly similar properties of the side chain (“.”) were denoted. (B) Autocatalytic processing of pro-zHtrA2. The indicated pro-zHtrA2 proteins, which were synthesized using an in vitro TNT SP6 system, were probed with D-Tag Ab. (C) Sequence alignment of the putative PDZ domain (AA 337–423) of zHtrA2. The XΦGΦ motif in the PDZ plays a key role in ligand binding, where G is highly conserved, and X and Φ represent any and hydrophobic AAs, respectively. (D) Endoproteolytic activity of zHtrA2. The level of zHtrA2 bound to the anti-FLAG beads was probed with D-Tag Ab. The immunoglobulin heavy (IgH; “*”) and light (IgL; “**”) chains are indicated. (E) Proteolytic cleavage of the hHtrA2’s cognate substrate, Parkin, by zHtrA2. The cleavage pattern of Parkin (17 and 19 kDa) was analyzed with the Parkin Ab. zHtrA2 was detected by D-Tag Ab. |
|
Fig. 5. zHtrA2 induces CASP-independent/serine protease-dependent or CASP-dependent cell death. (A) Schematic representation of HtrA2-mediated cell death. Under normal conditions, HtrA2 and Cyt C are localized in the mitochondrial IMS. Pro-CASP-9 and pro-CASP-3/7 are inactive zymogen or proenzyme initiator and executioner CASPs, respectively. XIAP binds to and inhibits active CASP-9 and -3/-7. In response to cell death stimuli, BAX/BAK dimers generate pores within the OMM, causing MOMP and the non-selective release of Cyt C and HtrA2 into the cytosol (Fig. 5D). The released Cyt C binds to apoptotic protease activating factor 1 (Apaf-1) to form oligomeric apoptosomes, followed by activation of the CASP cascade to induce CASP-dependent cell death. (a′) and (b′) are described in more detail in the right panel. (B) Interaction of hXIAP and zHtrA2 through the exposed N-terminal XIAP that antagonizes IBM. After performing the anti-FLAG bead pull-down like Fig. 4B, the samples were probed with Abs against the indicated proteins. HtrA2 was detected by D-Tag Ab. The (M)-HtrA2 denotes the N-terminal Met (M) in HtrA2 preceding the IBM shown in Fig. 5A (b′). The asterisk indicates the IgH chain. (C) The interaction between zHtrA2 and XIAP. The interaction between proteins was verified with GST pull-down by incubating the GST proteins bound to Glutathione Sepharose 4B beads and the cell lysates containing the indicated HtrA2 proteins for 16 h at 4 °C. (D) Verification of mitochondrial release of HtrA2 into the cytosol via BAX-mediated MOMP. HEK293T cells were co-transfected with plasmids encoding C-terminal FLAG tagged pro-HtrA2 S/A and BAX, HtrA2 was immunostained with D-Tag Ab. The cells were treated with 20 μM pan-CASP inhibitors 6 h after transfection to maintain cell shapes. In parallel, whole-cell lysates (W) were separated into the mitochondrial (M) and cytosol (C) fractions, and probed with Abs for the indicated proteins. Voltage-dependent action channel (VDAC) and β-actin were used as mitochondrial (M) and cytosolic (C) markers, respectively. (E) The role of released zHtrA2 in promoting CASP-dependent cell death by inhibiting the XIAP-mediated inhibition of CASPs. For XIAP inhibition by HtrA2, GSH-bound GST-XIAP was incubated for 16 h at 4 °C with (A)-HtrA2 S/A pulled down with FLAG beads and incubated with the HEK293T S100 extract with Cyt C and dATP for 90 min at 30 °C. CASP-dependent cell death was determined by detection of active CASP-9/-3 and cleaved ICAD by IB. (F) Determination of serine protease-dependent cell death. HEK293T cells were co-transfected with plasmids encoding the indicated proteins; the plasmid expressing GFP was used as the transfection control. Ctrl indicates cells transfected only with the plasmid encoding GFP. At 16 h post-transfection, the GFP-positive (GFP + ) cells were visualized by fluorescence microscopy. The values on the y-axis were expressed as percentages (%) by dividing the number of round (dead, white arrow) GFP + cells by the total number of GFP + cells. The data are presented as means ± SEM, and the significance of the differences was calculated by the paired t-test using GraphPad Prism 8. 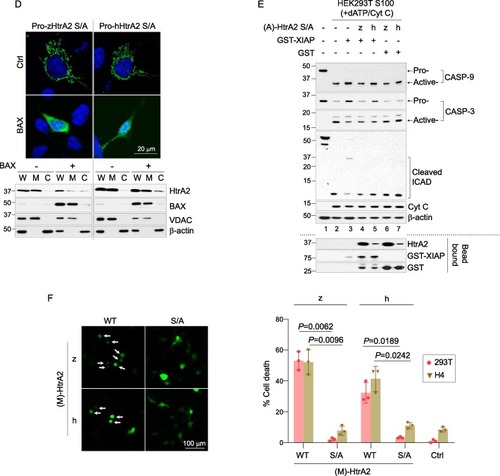

|
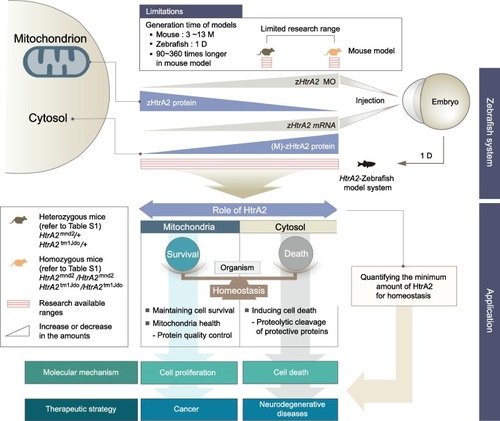
Fig. 6. Schematic diagrams of the prospective studies of HtrA2 using the HtrA2-zebrafish model system. Maintaining homeostasis from the molecular to organismic level plays a crucial role in determining the survival and death of cells and even organisms. The zebrafish system can be used to quantitatively manipulate and analyze the expression of the specific target gene (e.g. HtrA2) by injecting a wide range of known amounts of the target MO or mRNA into zebrafish embryos. Remarkably, since pro-zHtrA2 containing MTS and (M)-zHtrA2 are localized in the mitochondria and cytosol, respectively, these characteristics of HtrA2 are helpful for studying how the quantitative changes of HtrA2 in the mitochondria or cytosol play an essential role in regulating the balance between the death and survival of cells and organisms. The studies using the HtrA2-zebrafish model system may provide important insights on the molecular pathogenesis of the diseases caused by the dysregulation of the balance between death and survival, i.e., cancer and neurodegenerative diseases, and the potential therapeutic strategies. M and D indicate month and day, respectively. |
Reprinted from Gene, 819, Nam, M.K., Moon, J.M., Kim, G.Y., Min Kim, S., Rhim, H., The Novel Human HtrA2 Ortholog in Zebrafish: New Molecular Insight and Challenges into the Imbalance of Homeostasis, 146263, Copyright (2022) with permission from Elsevier. Full text @ Gene