
- Title
-
Limonin Alleviates Non-alcoholic Fatty Liver Disease by Reducing Lipid Accumulation, Suppressing Inflammation and Oxidative Stress
- Authors
- Li, Y., Yang, M., Lin, H., Yan, W., Deng, G., Ye, H., Shi, H., Wu, C., Ma, G., Xu, S., Tan, Q., Gao, Z., Gao, L.
- Source
- Full text @ Front Pharmacol
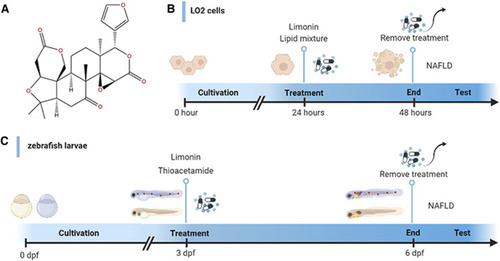
Design of experimental process. |
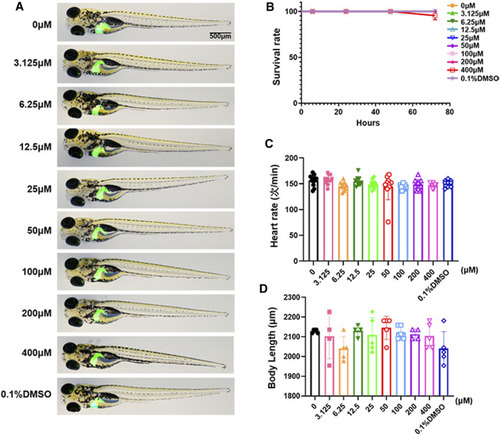
Toxicology of limonin in zebrafish larvae. (A) The effect of zebrafish larvae exposed to different concentrations of limonin for 72 h on zebrafish larval morphology and liver development (n = 6 per group) (B) The effect of different concentrations of limonin on the survival rate of zebrafish larvae (n = 22 per group). (C) Heart rate of zebrafish larvae exposed to different concentrations of limonin (n = 9–13 per group). (D) The body length of zebrafish larvae exposed to different concentrations of limonin (n = 4–6 per group). The data are shown as mean ± SD. |
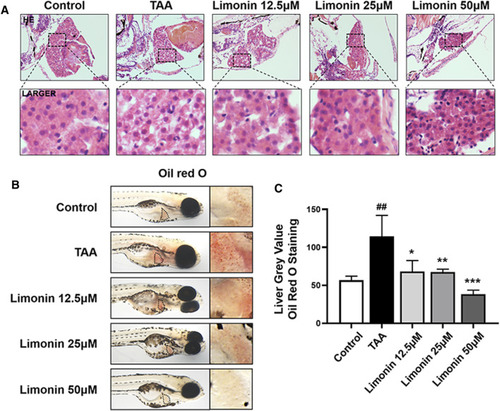
Limonin alleviated TAA-induced liver hepatic steatosis in zebrafish larvae. (A) H&E staining of zebrafish larvae. Figures are magnified as ×400 (n = 5–7 per group). (B) Whole fish staining with Oil Red O. Figures are magnified as ×50 (n = 3 per group). (C) Quantitative analysis of the liver gray value of Oil Red O using ImageJ software. Data are shown as the mean ± SD. #p < 0.05, ##p < 0.01, ###p < 0.001 vs control group; *p < 0.05, **p < 0.01, ***p < 0.001 vs TAA group. |
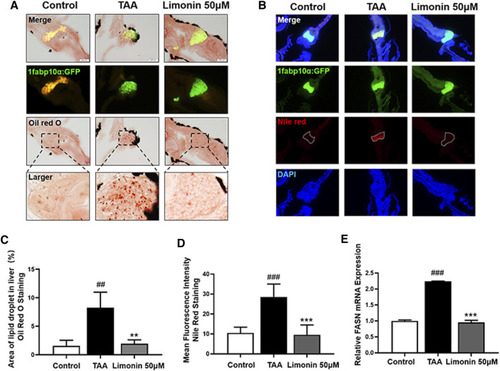
Limonin reduced lipid accumulation caused by TAA in zebrafish liver. (A) Oil red O staining of frozen sections of zebrafish larvae. (B) Frozen liver sections of zebrafish larvae with liver-specific eGFP expression were stained with Nile Red. Figures are magnified as ×200. (C) Quantitative analysis of the area of lipid droplet in liver based on Oil Red O staining. (D) Quantitative analysis of the liver mean fluorescence intensity of Nile Red. (E) Real-time PCR analysis of FASN mRNA levels in zebrafish larvae. The mRNA levels were normalized to β-actin mRNA levels and presented as fold change compared with the control group. Data are shown as the mean ± SD (n = 6–8 per group). #p < 0.05, ##p < 0.01, ###p < 0.001 vs control group; *p < 0.05, **p < 0.01, ***p < 0.001 vs TAA group. |
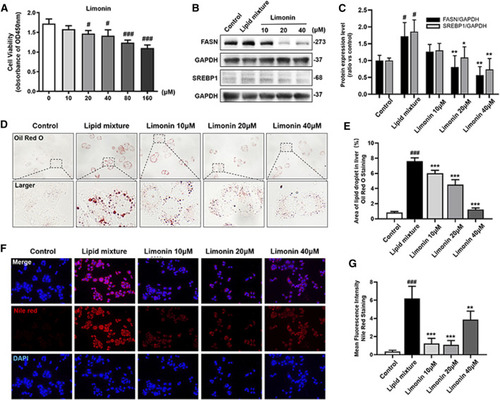
Limonin reduced lipid accumulation in LO2 cells stimulated by lipid mixture. (A) LO2 cells viability detection (OD 450 nm absorbance) (n = 4 per group). (B) Western blot analysis of the expression of FASN and SREBP1. GAPDH was used as an internal control. (C) Relative quantitative protein expression of FASN and SREBP1. (D) LO2 cells oil red O staining. Figures are magnified as ×400. (E) Quantitative analysis of the area of lipid droplets based on Oil Red O staining in LO2 cells. (F) Nile red staining of LO2 cells. Figures are magnified as ×200. (G) Quantitative analysis of the mean fluorescence intensity of Nile Red. Data are shown as the mean ± SD from three independent experiments. #p < 0.05, ##p < 0.01, ###p < 0.001 vs control group; *p < 0.05, **p < 0.01, ***p < 0.001 vs TAA group. |
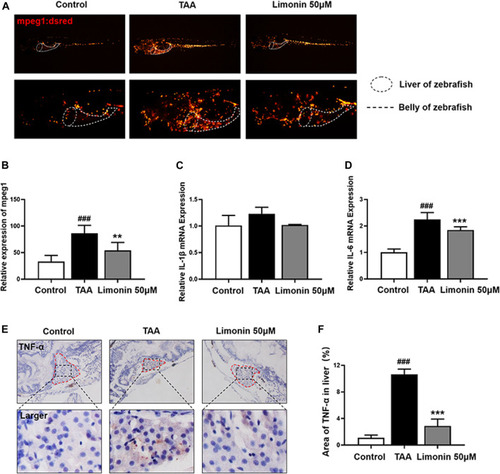
Limonin reduced liver inflammatory damage caused by TAA. (A) Limonin reduced the infiltration of macrophages in the liver of zebrafish during TAA exposure. Figures are magnified as ×25 and 50× (n = 6 per group). (B) Relative expression of mpeg1 in zebrafish liver. (C,F) Immunohistochemical staining of TNF-α and F4/80 in paraffin sections of zebrafish larvae (n = 4 per group). (D,G) Quantify the fluorescence intensity of TNF-α and F4/80 proteins. (E,H) Real-time PCR analysis of IL-1β and IL-6 mRNA levels in zebrafish larvae. The mRNA levels were normalized to β-actin mRNA levels and presented as fold change compared with the control group (n = 3 per group). Data are shown as the mean ± SD. #p < 0.05, ##p < 0.01, ###p < 0.001 vs control group; *p < 0.05, **p < 0.01, ***p < 0.001 vs TAA group. |
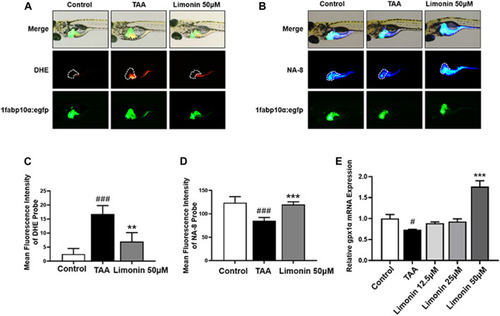
Limonin protected zebrafish larvae against oxidative stress. (A) Fluorescence micrographs of DHE. Figures are magnified as 50×. (B) Fluorescence micrographs of NA-8. Figures are magnified as ×50 (C) ROS quantification according to the mean intensity of red fluorescence. (D) GSH quantification according to the mean intensity of blue fluorescence. (E) Real-time PCR analysis of gpx1a mRNA levels in zebrafish larvae. The mRNA levels were normalized to β-actin mRNA levels and presented as fold change compared with the control group. Data are shown as the mean ± SD (n = 4–6 per group). #p < 0.05, ##p < 0.01, ###p < 0.001 vs control group; *p < 0.05, **p < 0.01, ***p < 0.001 vs TAA group. |
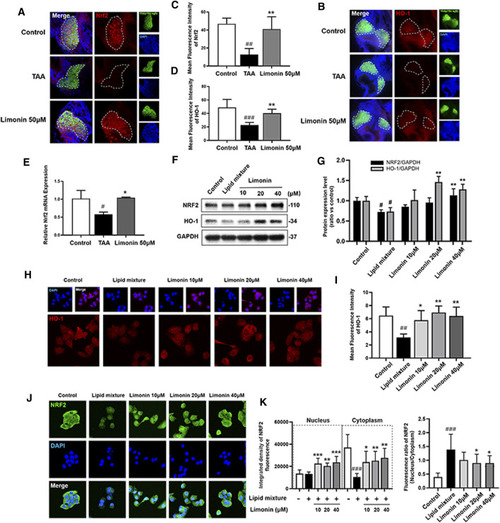
Limonin exerts the effect of anti-oxidative stress through the NRF2/HO-1 pathway. (A) Frozen liver sections of zebrafish larvae with liver-specific eGFP expression were immunofluorescent stained with NRF2 (n = 6–8 per group). (B) Immunofluorescence staining of HO-1 in zebrafish larvae (n = 6–8 per group). (C–D) Quantitative analysis of the liver mean fluorescence intensity of NRF2 and HO-1. (E) Real-time PCR analysis of NRF2 mRNA levels in zebrafish larvae. The mRNA levels were normalized to β-actin mRNA levels and presented as fold change compared with the control group (n = 3 per group). (F) Western blot analysis of the expression of HO-1 and NRF2. GAPDH was used as an internal control. (G) Relative quantitative protein expression of NRF2 and HO-1. (H) Immunofluorescence staining of HO-1 in LO2 cells. (I) Cellular fluorescence intensity of HO-1. (J) Immunofluorescence staining of NRF2 in LO2 cells. (K) The respective fluorescence intensity of the nucleus, cytoplasm and ratio of NRF2. Data are shown as the mean ± SD from three independent experiments. #p < 0.05, ##p < 0.01, ###p < 0.001 vs control group; *p < 0.05, **p < 0.01, ***p < 0.001 vs TAA group. |
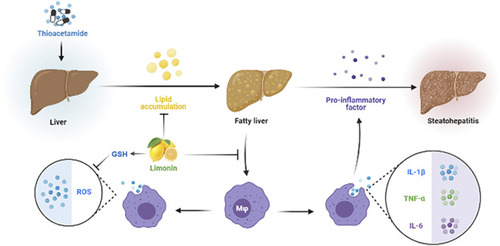
Diagram of the protective mechanism of limonin on non-alcoholic fatty liver disease. |