
- Title
-
MXD3 Promotes Obesity and the Androgen Receptor Signaling Pathway in Gender-Disparity Hepatocarcinogenesis
- Authors
- Tsai, Y.W., Jeng, K.S., He, M.K., Hsieh, Y.W., Lai, H.H., Lai, C.Y., Huang, C.C., Chang, C.F., Huang, C.T., Her, G.M.
- Source
- Full text @ Cells
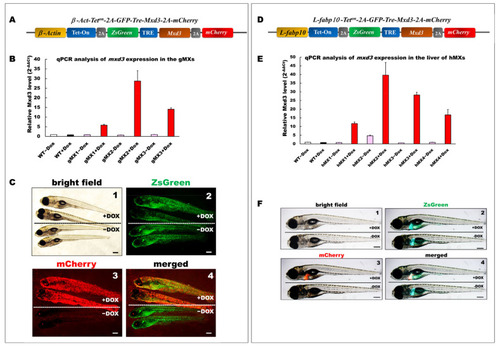
Generation and depiction of inducible Mxd3 transgenic zebrafish lines, gMXs and hMXs. (A) Schematic drawing of the DNA construct used to produce gMX (Tg(-2.5β-Act:Teton-2A-ZsGreen-mxd3-2A-mCherry) transgenic zebrafish. (B) Quantification of mxd3 expression using (qRT-PCR) analysis. gMX1-3 treated with doxycycline (+Dox) and without (−Dox) represent three discrete transgenic lines. Control: wild type (WT)+Dox and WT−Dox. (C) Globally inducible Mxd3 expression in gMX2 at 6 days post fertilization (dpf). Transgenic larvae were treated with 25 μg/mL Dox from 24 to 6 dpf. Scale bar: 100 μm. (D) Schematic drawing of the plasmid construct used to produce hMX(Tg(-2.8fabp10a:Teton-2A-ZsGreen-mxd3-2A-mCherry)) transgenic zebrafish. (E) Quantification of mxd3 expression using (qRT-PCR) analysis. hMX1-4 treated with doxycycline (+Dox) and without (−Dox) represent four discrete transgenic lines. Control: WT+Dox and WT−Dox. (F) Liver-specific inducible Mxd3 expression in the hMX3 at 7 dpf. Transgenic larvae were treated with 25 μg/mL Dox from 2 to 7 dpf. Scale bar: 100 μm. |
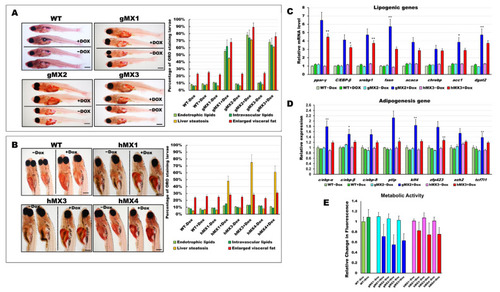
Characterization of early onset of adipogenesis and energy balance in gMXs and hMXs larvae. (A) Left: whole-mount ORO staining of WT ± Dox and gMXs (1–3) ± Dox larvae at 24 dpf. Scale bar: 100 μm. Right: the percentage of ORO-stained zebrafish larvae. (B) Left: whole-mount ORO staining of WT ± Dox and hMXs (1, 3, and 4) ± Dox larvae at 24 dpf. Scale bar: 125 μm. Right: the percentage of ORO-stained zebrafish larvae. (C) Molecular analysis of gMX2 and hM3 larvae revealed the upregulation of lipogenic genes, ppar-γ, C/EBP-β, srebp1, fasn, acaca, chrebp, acc1, and dgat2. (D) Molecular analysis of gMX2 and hM3 larvae revealed an upregulation of adipogenesis genes, c/ebp-α, c/ebp-β, c/ebp-δ, ptip, klf4, zfp423, ezh2, and tcf7l1. (E) Response to gMX2 and hM3 larvae by the Alamar Blue assay. Data are conveyed as the relative difference in signal intensity in three discrete assays (mean ± SEM, n = 40), Statistically significant differences from the controls are indicated by * (p < 0.05), and ** (p < 0.01). |
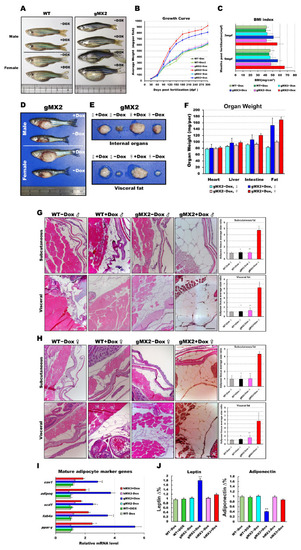
Expression levels of mxd3 regulate somatic growth and obesity in gMX2 adults. (A) Macroscopic view of male and female gMX2 adults compared with WT controls at 10 mpf. (B) Growth curves of zebrafish from juvenile to adult stages in two discrete groups (WT ± Dox, gMX2 ± Dox, and hMX3 ± Dox; n = 24/group). (C) Bar chart displaying the BMI index in two discrete groups (n = 25/group) at 3 and 10 mpf stages. (D) Viscera and visceral fat pads of gMX2 groups at 12 mpf, displaying (E) enlarged internal organs, and (F) fat pad size. (G,H) Histological characteristics of adipose tissue in H&E-stained sections displaying (G) male and (H) female samples. Left: H&E-stained sections displaying adipose tissues of WT ± Dox and gMX2 ± Dox male groups (n = 6/group). Right: morphometric analysis of fat on adipose tissues of average size in each group (n = 6/group). (I) Molecular analysis of visceral adipose tissue of gMX2 and hMX3 groups revealed upregulation of mature adipocyte markers genes, such as ppar-γ, fabp4, scd1, adipoq, and cav1. (J) Blood analysis of leptin and adiponectin. Statistically significant differences from the controls are indicated by * (p < 0.05), and ** (p < 0.01). |
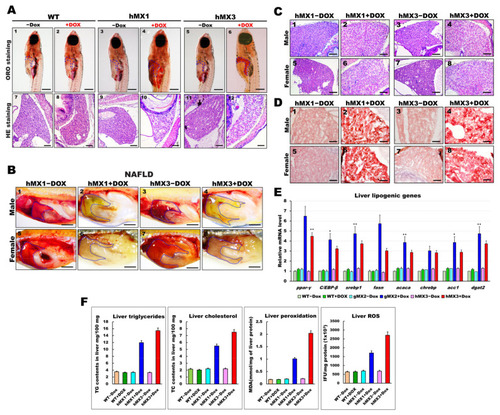
Development of NAFLD phenotypes in hMX1 and hMX3 juvenile (< 30 dpf) and adult zebrafish related to various fat accumulation. (A) ORO staining of WT ± Dox (panels 1 and 2), hMX1±Dox (panels 3 and 4), and hMX3 ± Dox (panels 5 and 6) juvenile zebrafish at 24 dpf (scale bars: 200 m). The liver regions are circled. H&E staining of liver sections of WT ± Dox (panels 7 and 8), hMX1 ± Dox (panels 9 and 10), and hMX3 ± Dox (panels 11 and 12) juvenile zebrafish at 24 dpf. Scale bars: 100 μm. (B) Gross liver images of hMX1 ± Dox and hMX3 ± Dox males (panels 1–4) and females (panels 5–8) at 4 mpf. Scale bar: 2 mm). (C) H&E staining of liver sections of hMX1 ± Dox and hMX3 ± Dox males and females at 6 mpf. Scale bars: 100 μm (D) ORO staining of frozen liver sections of hMX1 ± Dox and hMX3 ± Dox males and females at 4 mpf. Scale bars: 50 μm. (E) Molecular analysis of gMX2 and hMX3 NAFL revealed upregulation of selected lipid regulatory genes, including ppar-γ, C/EBP-β, srebp1, fasn, acaca, chrebp, acc1, and dgat2. (F) Biochemical analysis of triglycerides, total cholesterol, and oxidative stress was completed in triplicate in three four-month-old fish couples per group (WT ± Dox, hMX1 ± Dox, and hMX3 ± Dox). Statistically significant differences from the controls are indicated by * (p < 0.05), and ** (p < 0.01). |
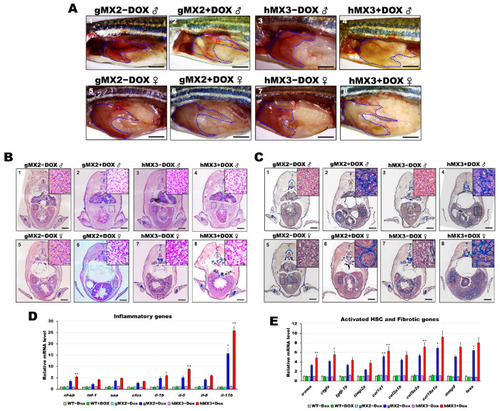
Nonalcoholic steatohepatitis (NASH) phenotypes in gMX2 and hM3 zebrafish at 8 mpf. (A) Gross liver of gMX2 ± Dox and hMX3 ± Dox male (panels 1–4) and female (panels 5–8) zebrafish at 8 mpf. The livers are circled. Scale bar: 2 mm. (B) H&E staining shown increased Mallory−Denk bodies (MDBs) with ballooned cells and lobular inflammation (panels 1–4 for male and panels 5–8 for female). Scale bar: 1 mm. Insets: normal hepatocytes (panels 1, 3, 5, and 7), MDBs and lobular inflammation (panels 2, 4, 6, and 8). Scale bar: 25 μm. (C) Masson’s trichrome staining of the liver tissue from gMX2 ± Dox and hMX3 ± Dox (panels 1–4 for male and panels 5–8 for female zebrafish). Scale bar: 1 mm. Insets: normal hepatocytes (panels 1, 3, 5, and 7); fibrosis (panels 2 and 6) and scar tissue linked with liver fibrosis (panel 4) and cirrhosis (panel 8). Scale bar: 25 μm. (D) qRT-PCR analysis of gMX2 and hMX3 NASH discovered upregulated inflammatory genes and (E) activated HSC and fibrotic genes. Statistically significant differences from the controls are indicated by * (p < 0.05), and ** (p < 0.01). |
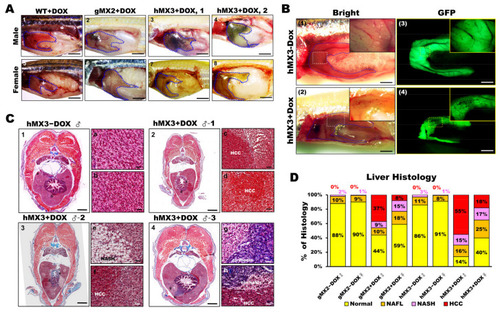
Male hMX3 zebrafish progress NAHCC at 10 mpf. (A) Gross liver of WT ± Dox, gMX2 ± Dox, and hMX3 ± Dox male (panels 1–4), and female (panels 5–8) zebrafish at 10 mpf. Scale bar: 3 mm. The livers are circled. Scale bar: 3 mm. (B) Angiogenesis and disruption of vascular architecture linked to HCC progression in the livers of hMX3 using bright field microscopy: (1) hMX3 − Dox and (2) hMX3 + Dox with corresponding GFP fluorescence images (3) hMX3 − Dox and (4) hMX3 + Dox. Scale bar: 3 mm. (C) Masson’s trichrome stained livers of male zebrafish (1) hMX3 − Dox indicative of normal liver, (2) hMX3 + Dox 1 (sample 1), (3) hMX3 + Dox 2, and (4) hMX3 + Dox 3. Scale bar: 2 mm. Insets: images of normal liver (panels a and b), HCC (panels c and d), steatohepatitis concomitant with HCC (panels e and f), and hMX3 + Dox 3 advanced fibrosis (cirrhosis) concomitant with HCC (panels g and h). Scale bar: 50 μm. (D) Percentage of histological features of liver sections from different experimental groups (n = 5−10). Masson’s trichrome staining results are shown as the percentages of fish displaying normal characteristics (yellow), steatosis (orange), NASH (pink), and HCC (red). |
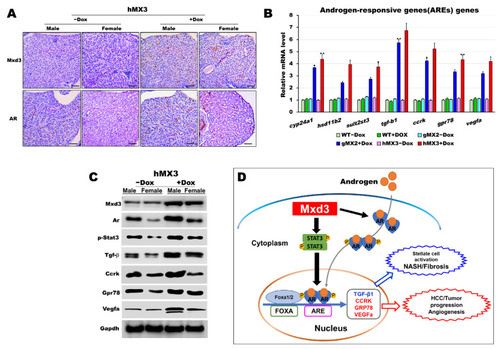
AR is certainly correlated with Mxd3 in the male hMX3. (A) AR and Mxd3 staining in the liver tissue of hMX3 ± Dox as determined by immunohistochemical analysis. Scale bar: 100 μm. (B,C) Molecular analysis of androgen-responsive gene expression by (B) qRT-PCR and (C) western blot analysis in the male livers of WT ± Dox, gMX2 ± Dox and hMX3 ± Dox. (D) Schematic diagram of the mechanism by which Mxd3 joins the NAHCC progression of the male hMX3 + Dox zebrafish. Mxd3 mediates the androgen receptor signaling in HCC. Statistically significant differences from the controls are indicated by * (p < 0.05), and ** (p < 0.01). |
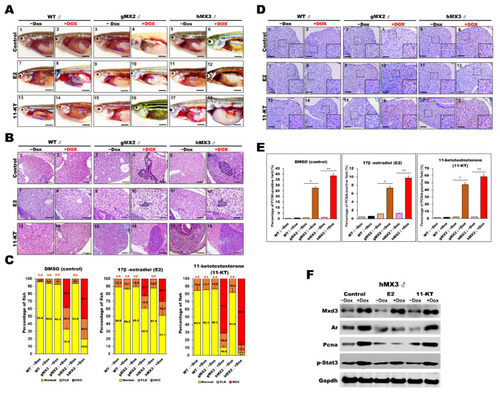
Treatment with sex hormones affects hepatocyte proliferation during NAHCC progression in adult gMX2 and hMX3 male fish. WT ± Dox, gMX2 ± Dox, and hMX3 ± Dox (6 mpf) groups were treated with E2 and 11-KT for 90 days. (A) Representative gross observations (Scale bar: 2.5 mm) and (B) liver histology of WT ± Dox, gMX2 ± Dox, and hMX3 ± Dox after no treatment (control) and treatment with E2 and 11-KT. Scale bar: 100 μm. (C) Percentage of NAHCC phenotypes observed from the liver histology in (B). Scale bar: 100 μm. (D) PCNA staining of liver slices of male zebrafish in distinct experimental groups. Scale bars, 100 μm. Insets, Scale bars, 25 μm. (E) Percentage of hepatocyte proliferation in the male zebrafish in discrete treatment groups (n = 5−10). (F) Western blot analysis in the different treatments of male hMX3 ± Dox livers. Statistically significant differences from the controls are indicated by * (p < 0.05), and ** (p < 0.01). |