
|
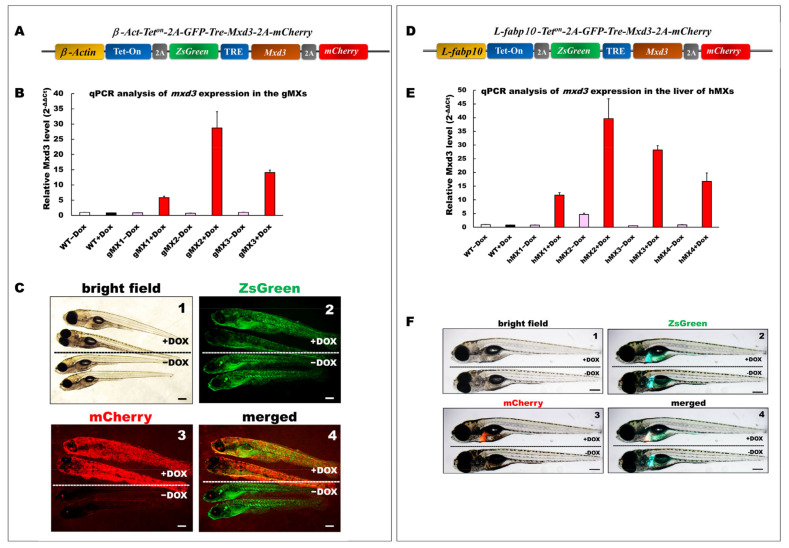
Figure 1 Generation and depiction of inducible Mxd3 transgenic zebrafish lines, gMXs and hMXs. (A) Schematic drawing of the DNA construct used to produce gMX (Tg(-2.5β-Act:Teton-2A-ZsGreen-mxd3-2A-mCherry) transgenic zebrafish. (B) Quantification of mxd3 expression using (qRT-PCR) analysis. gMX1-3 treated with doxycycline (+Dox) and without (−Dox) represent three discrete transgenic lines. Control: wild type (WT)+Dox and WT−Dox. (C) Globally inducible Mxd3 expression in gMX2 at 6 days post fertilization (dpf). Transgenic larvae were treated with 25 μg/mL Dox from 24 to 6 dpf. Scale bar: 100 μm. (D) Schematic drawing of the plasmid construct used to produce hMX(Tg(-2.8fabp10a:Teton-2A-ZsGreen-mxd3-2A-mCherry)) transgenic zebrafish. (E) Quantification of mxd3 expression using (qRT-PCR) analysis. hMX1-4 treated with doxycycline (+Dox) and without (−Dox) represent four discrete transgenic lines. Control: WT+Dox and WT−Dox. (F) Liver-specific inducible Mxd3 expression in the hMX3 at 7 dpf. Transgenic larvae were treated with 25 μg/mL Dox from 2 to 7 dpf. Scale bar: 100 μm.