
|
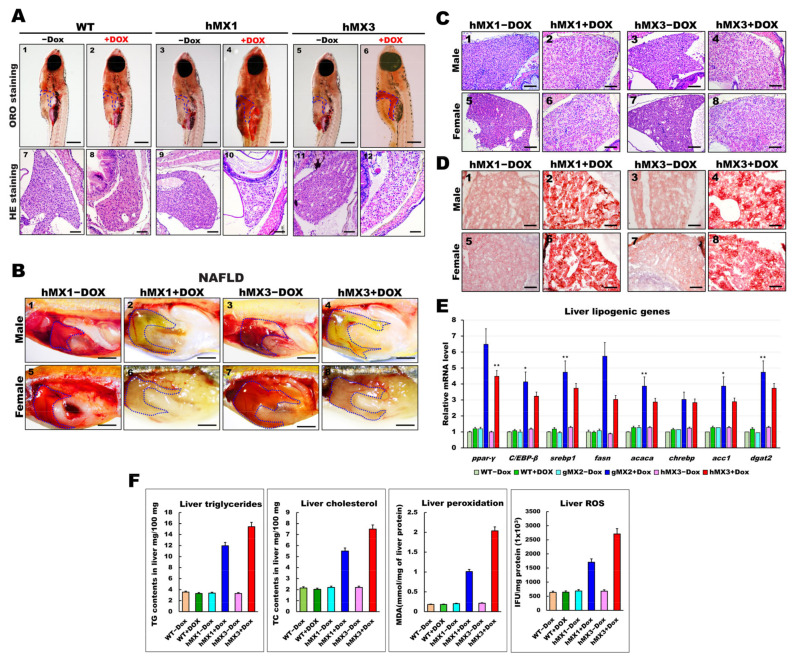
Figure 4 Development of NAFLD phenotypes in hMX1 and hMX3 juvenile (< 30 dpf) and adult zebrafish related to various fat accumulation. (A) ORO staining of WT ± Dox (panels 1 and 2), hMX1±Dox (panels 3 and 4), and hMX3 ± Dox (panels 5 and 6) juvenile zebrafish at 24 dpf (scale bars: 200 m). The liver regions are circled. H&E staining of liver sections of WT ± Dox (panels 7 and 8), hMX1 ± Dox (panels 9 and 10), and hMX3 ± Dox (panels 11 and 12) juvenile zebrafish at 24 dpf. Scale bars: 100 μm. (B) Gross liver images of hMX1 ± Dox and hMX3 ± Dox males (panels 1–4) and females (panels 5–8) at 4 mpf. Scale bar: 2 mm). (C) H&E staining of liver sections of hMX1 ± Dox and hMX3 ± Dox males and females at 6 mpf. Scale bars: 100 μm (D) ORO staining of frozen liver sections of hMX1 ± Dox and hMX3 ± Dox males and females at 4 mpf. Scale bars: 50 μm. (E) Molecular analysis of gMX2 and hMX3 NAFL revealed upregulation of selected lipid regulatory genes, including ppar-γ, C/EBP-β, srebp1, fasn, acaca, chrebp, acc1, and dgat2. (F) Biochemical analysis of triglycerides, total cholesterol, and oxidative stress was completed in triplicate in three four-month-old fish couples per group (WT ± Dox, hMX1 ± Dox, and hMX3 ± Dox). Statistically significant differences from the controls are indicated by * (p < 0.05), and ** (p < 0.01).