
- Title
-
Modulation of retinoid-X-receptors differentially regulates expression of apolipoprotein genes apoc1 and apoeb by zebrafish microglia
- Authors
- Thiel, W., Esposito, E.J., Findley, A.P., Blume, Z.I., Mitchell, D.M.
- Source
- Full text @ Biol. Open
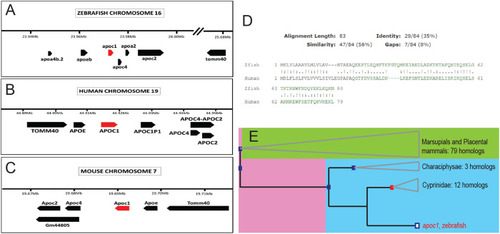
Orthology of zebrafish apoeb and apoc1 to human and mouse genes. (A–C) Organization of the apolipoprotein gene clusters in zebrafish (A), human (B), and mouse (C). (D) Amino acid alignment of zebrafish APOC1 to human APOC1. (E) Phylogenetic relationship of zebrafish apoc1 to the shown species as determined by ensembl.org. |
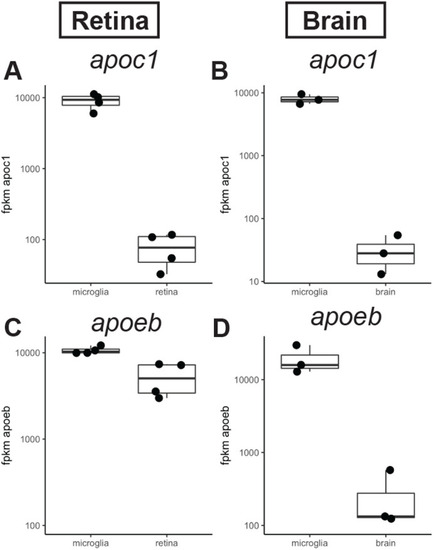
Expression of apoc1 and apoeb in the zebrafish CNS measured by RNA-seq. (A,B) Normalized expression (fpkm, fragments per kilobase million reads) of apoc1 in sorted populations of microglia compared other cell types isolated from regenerating zebrafish retina (A; Mitchell et al., 2019) or zebrafish brain (B; Oosterhof et al., 2017). (C,D) Normalized expression (fpkm) of apoeb in sorted populations of microglia compared other cell types isolated from regenerating zebrafish retina (A; Mitchell et al., 2019) or zebrafish brain (B; Oosterhof et al., 2017). |
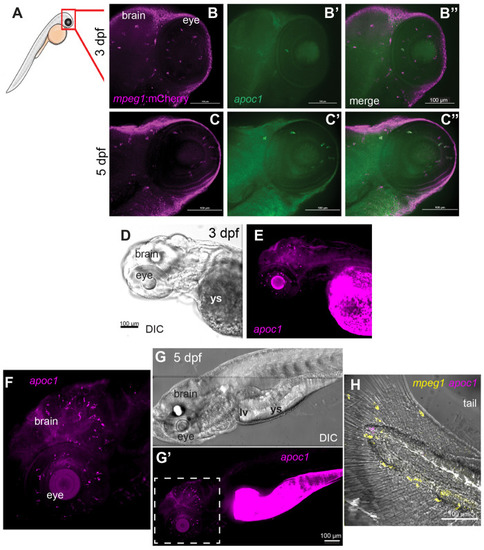
Expression of apoc1 in the zebrafish embryo visualized by in situ hybridization. (A) Region of imaging of embryos at 3 and 5 dpf is indicated by the red box. (B–C″) In situ hybridization for apoc1 using in-house generated RNA probes (green) in mpeg1:mCherry (magenta) transgenic embryos at the indicated ages. (D) DIC image of 3 dpf embryo. (E) Visualization of apoc1 transcripts in the 3 dpf embryo. (F–H) Visualization of apoc1 transcripts in situ in whole embryos at 5 dpf, using HCR in situ hybridization. (F) Fluorescent image of apoc1 HCR probe signal showing transcripts in the head (brain and eyes). (G) DIC image of whole embryo. (G′) Fluorescent image of apoc1 HCR probe signal showing transcripts in the head, eyes, region of remaining yolk sac (ys), and region of developing liver(lv)/gut. (F) Enlarged region indicated by dashed box in G′; transcripts in the developing CNS are consistent with microglia pattern and morphology. (H) Merged image of DIC and fluorescent HCR probe signals to detect mpeg1 and apoc1 in the tail. Transcripts for apoc1 are not observed in mpeg1+ macrophages. Images are representative of n=6 embryos per timepoint. |
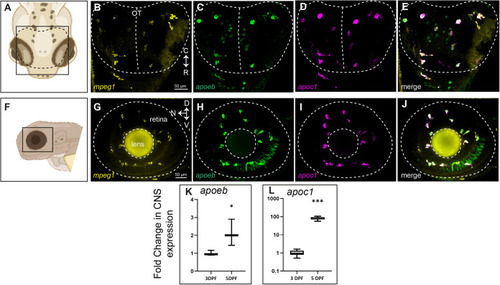
Multiplex detection of mpeg1, apoc1, and apoeb transcripts in the developing zebrafish CNS. HCR probe sets were used to detect mpeg1, apoc1, and apoeb transcripts in whole zebrafish embryos at 3 dpf. (A) Region and orientation of imaging of the zebrafish brain. Orientation markers: C, caudal; R, rostral. (B–D) Signal from each probe set detected within the optic tectum. (E) Merge of all three probe set signals. The region indicated by the dotted lines pertains to the optic tectum. (F) Region and orientation of imaging of the zebrafish eye/retina. Orientation markers: D, dorsal; N, nasal; V, ventral. (G–I) Signal from each probe set detected within the eye/retina. (J) Merge of all three probe set signals. The region indicated by the dotted lines pertains to the embryonic eye boundary (outer circle) as well as the lens (inner circle). In embryos, the eye is comprised nearly entirely of lens and retina. (K,L) Fold change in expression in heads from 3 to 5 dpf of apoeb (K) and apoc1 (L) measured by RT-qPCR. Images in A and F were generated in BioRender. Images are representative of n=6 embryos. |
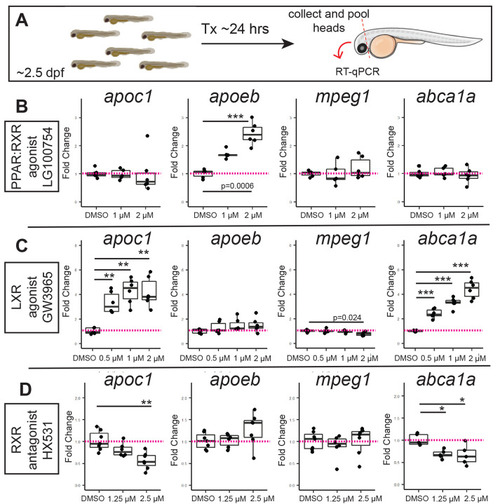
Effects of pharmacological PPAR, LXR, and RXR modulation on apoeb and apoc1 expression in the developing zebrafish CNS. (A) Experimental design for treatment by immersion with selected compounds. After 24 h of treatment, whole heads were removed and pooled for each group for RNA extraction and cDNA synthesis. (B) Effects of PPAR-RXR agonist LG100754 on the indicated genes measured by qPCR. (C) Effects of LXR agonist GW3965 on the indicated genes measured by qPCR. (D) Effects of RXR antagonist HX531 on the indicated genes measured by qPCR. In all experiments, the vehicle treated (DMSO) group served as control. Each dot represents the value from one sample of pooled heads (3–9 heads pooled per sample). Statistically significant differences are indicated (***P<10−4, **P<0.01, *P∼0.02). Image in A was generated in BioRender. |

Expression of apoc1 and apoeb measured in individual microglia in the zebrafish optic tectum by HCR WISH following PPAR, LXR, and RXR modulation. We performed HCR wholemount in situ hybridization (WISH) with probe sets to detect mpeg1, apoc1, and apoeb in embryos following treatment with the indicated compounds. Orientation and regions of imaging are as indicated previously for Fig. 4. (A–D) Single channel and merged images from optic tectum for each treatment group. Orientation markers: C, caudal; R, rostral. (E–H) Merged images of eye/retina. Images are representative of n=3–5 embryos per condition. |
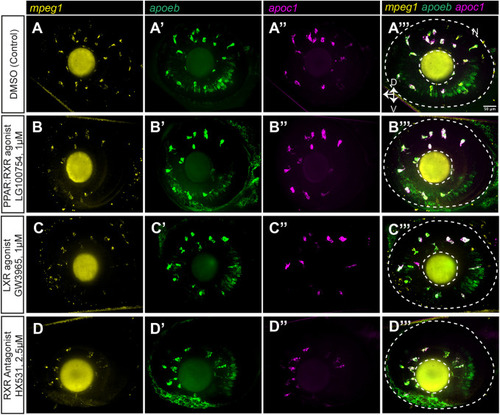
Expression of apoc1 and apoeb measured in individual microglia in the zebrafish eye/retina by HCR WISH following PPAR, LXR, and RXR modulation. We performed HCR wholemount in situ hybridization (WISH) with probe sets to detect mpeg1, apoc1, and apoeb in embryos following treatment with the indicated compounds. Orientation and regions of imaging are as indicated previously for Fig. 4. (A–D) Single channel and merged images from eye/retina for each treatment group. Orientation markers: D, dorsal; N, nasal; V, ventral. Images are representative of n=3–5 embryos per condition. |
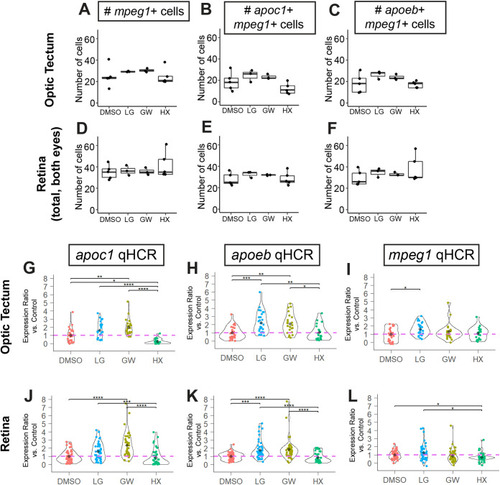
Quantification of HCR in situ images to analyze gene expression in microglia. Quantification of total numbers of mpeg1+ cells in the optic tectum and retina for the various treatments. Each dot represents the count from one embryo (A,D). Quantification of number of mpeg1+ cells also expressing the gene of interest, apoc1 or apoeb (B,C,E,F). (G–L) Analysis of signal intensity in individual microglia using qHCR for apoc1 (G,J), apoeb (H,K), and mpeg1 (I,L) transcripts detected in optic tectum or retina following the indicated treatments. Violin plots represent the distribution of individual cell measurements from each group, shown as a ratio of expression level compared to the average of the control group for each gene of interest. Each colored dot represents the value from one individual microglial cell. The black diamond within the violin plot indicates the mean of the group. Individual cell measurements were obtained from a total of 3–5 embryos per group. Statistically significant differences are indicated (****P<10−4, ***P<0.001, **P<0.01, *P<0.05). |
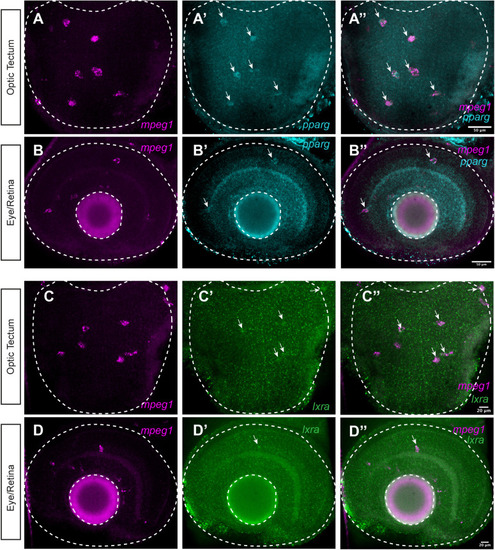
Expression of nr1c3 (pparg) and nr1h3 (lxra) by microglia in the developing CNS. We performed HCR WISH with probe sets to detect mpeg1, nr1c3 (pparg), and nr1h3 (lxra) in the CNS of 3-day-old zebrafish embryos (A–D). Single channel and merged images from optic tectum (A–B″) and eye/retina (C–D″) are shown. Images are z projections from 2–3 z stacks taken at 1 micron step size. Arrows indicate signal from pparg probe or lxra probe that co-localizes with mpeg1 probe signal. Images are representative of n=5 embryos. |