
Fig. 8.
- ID
- ZDB-FIG-220210-24
- Publication
- Thiel et al., 2021 - Modulation of retinoid-X-receptors differentially regulates expression of apolipoprotein genes apoc1 and apoeb by zebrafish microglia
- Other Figures
- All Figure Page
- Back to All Figure Page
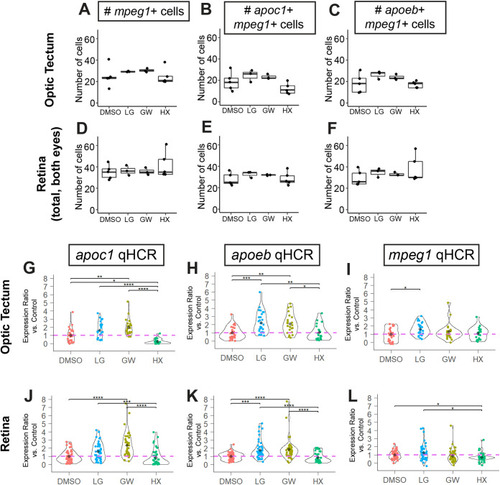
Quantification of HCR in situ images to analyze gene expression in microglia. Quantification of total numbers of mpeg1+ cells in the optic tectum and retina for the various treatments. Each dot represents the count from one embryo (A,D). Quantification of number of mpeg1+ cells also expressing the gene of interest, apoc1 or apoeb (B,C,E,F). (G–L) Analysis of signal intensity in individual microglia using qHCR for apoc1 (G,J), apoeb (H,K), and mpeg1 (I,L) transcripts detected in optic tectum or retina following the indicated treatments. Violin plots represent the distribution of individual cell measurements from each group, shown as a ratio of expression level compared to the average of the control group for each gene of interest. Each colored dot represents the value from one individual microglial cell. The black diamond within the violin plot indicates the mean of the group. Individual cell measurements were obtained from a total of 3–5 embryos per group. Statistically significant differences are indicated (****P<10−4, ***P<0.001, **P<0.01, *P<0.05). |