
Fig. 3.
- ID
- ZDB-FIG-220210-19
- Publication
- Thiel et al., 2021 - Modulation of retinoid-X-receptors differentially regulates expression of apolipoprotein genes apoc1 and apoeb by zebrafish microglia
- Other Figures
- All Figure Page
- Back to All Figure Page
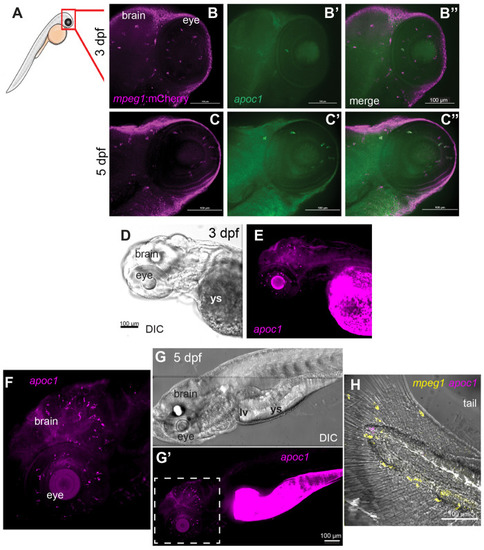
Expression of apoc1 in the zebrafish embryo visualized by in situ hybridization. (A) Region of imaging of embryos at 3 and 5 dpf is indicated by the red box. (B–C″) In situ hybridization for apoc1 using in-house generated RNA probes (green) in mpeg1:mCherry (magenta) transgenic embryos at the indicated ages. (D) DIC image of 3 dpf embryo. (E) Visualization of apoc1 transcripts in the 3 dpf embryo. (F–H) Visualization of apoc1 transcripts in situ in whole embryos at 5 dpf, using HCR in situ hybridization. (F) Fluorescent image of apoc1 HCR probe signal showing transcripts in the head (brain and eyes). (G) DIC image of whole embryo. (G′) Fluorescent image of apoc1 HCR probe signal showing transcripts in the head, eyes, region of remaining yolk sac (ys), and region of developing liver(lv)/gut. (F) Enlarged region indicated by dashed box in G′; transcripts in the developing CNS are consistent with microglia pattern and morphology. (H) Merged image of DIC and fluorescent HCR probe signals to detect mpeg1 and apoc1 in the tail. Transcripts for apoc1 are not observed in mpeg1+ macrophages. Images are representative of n=6 embryos per timepoint. |