
Image
|
Figure Caption
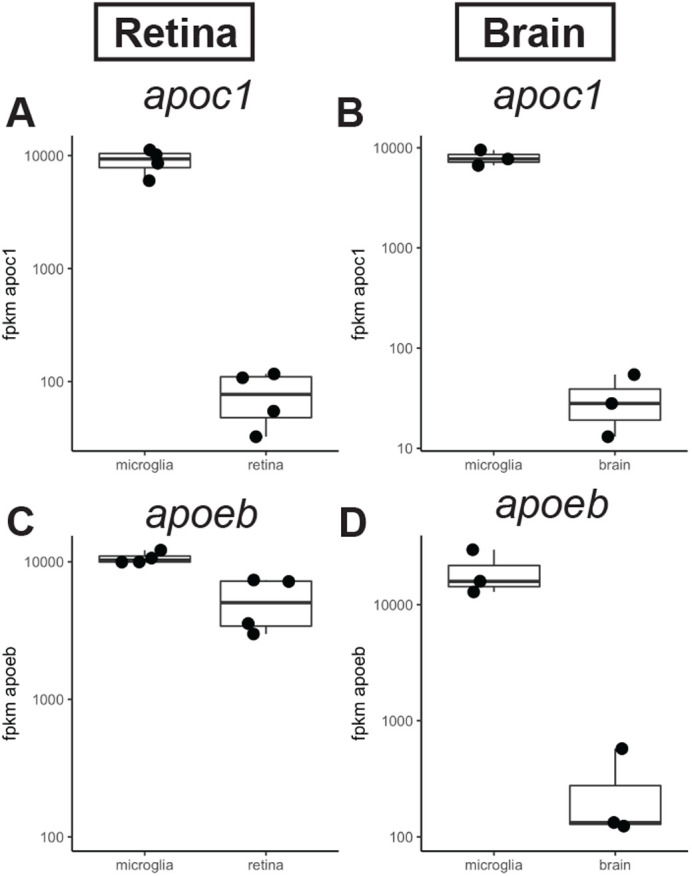
Fig. 2.
Expression of apoc1 and apoeb in the zebrafish CNS measured by RNA-seq. (A,B) Normalized expression (fpkm, fragments per kilobase million reads) of apoc1 in sorted populations of microglia compared other cell types isolated from regenerating zebrafish retina (A; Mitchell et al., 2019) or zebrafish brain (B; Oosterhof et al., 2017). (C,D) Normalized expression (fpkm) of apoeb in sorted populations of microglia compared other cell types isolated from regenerating zebrafish retina (A; Mitchell et al., 2019) or zebrafish brain (B; Oosterhof et al., 2017).
Acknowledgments
This image is the copyrighted work of the attributed author or publisher, and
ZFIN has permission only to display this image to its users.
Additional permissions should be obtained from the applicable author or publisher of the image.
Full text @ Biol. Open