FIGURE SUMMARY
Title

Co-occurrence of BAP1 and SF3B1 mutations in uveal melanoma induces cellular senescence

Authors
Yu, L., Zhou, D., Zhang, G., Ren, Z., Luo, X., Liu, P., Plouffe, S.W., Meng, Z., Moroishi, T., Li, Y., Zhang, Y., Brown, J.H., Liu, S., Guan, K.L.
Source
Full text @ Mol. Oncol.

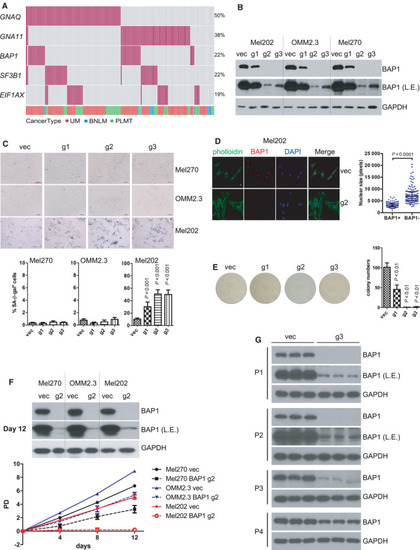
BRCA1‐associated protein 1 (BAP1) deficiency in UM cells with mutant splicing factor 3B subunit 1 (SF3B1) induces senescent phenotype. (A) Oncoprint depicting the five genes that are frequently mutated in UM across three studies, including the TCGA uveal melanoma (UM) dataset [4] downloaded from cBioportal [58], the exome sequencing UM dataset [8] and targeted amplicon‐based next‐generation sequencing UM dataset [14], blue nevus‐like melanoma (BNLM) [12, 13] and primary leptomeningeal melanocytic tumor (PLMT) [14]. Each bar in a column represents one patient, and each red bar represents the presence of the specified mutation. Data are from 179 patients. P values for mutual exclusivity of the paired gene mutations were derived from Fisher’s exact test. (B) Immunoblots show the knockout (KO) efficiency of three different BAP1‐targeting sgRNAs by lentivirus CRISPR‐Cas9. L.E. represents a longer exposure of BAP1 immunoblot. The blots shown are representative of three independent experiments. (C) Images show senescence‐associated β‐galactosidase staining in UM cells after BAP1 KO. G1, g2, g3 represent the three different sgRNAs used in panel B. The scale bar represents 100 μm. Graph represents the percentage of β‐galactosidase‐positive cells versus total cells (at least 200 cells were counted in random fields per group). The data are presented as the mean ± SD (n = 3) from one representative experiment out of three. One‐way ANOVA followed by Tukey test was used for statistical analysis. (D) Representative images for nuclear size of Mel202 cells. Immunofluorescence staining was performed for F‐actin (green, phalloidin), BAP1 (red), and DNA (blue, 4’,6‐diamidino‐2‐phenylindole). The scale bar represents 5 μm. Quantification of nuclear size of BAP1‐proficient and BAP1‐deficient Mel202. The data are presented as the median with interquartile range (at least 100 cells were counted in random fields per group) from one representative experiment (n = 3) out of three. The Mann–Whitney U‐test was used for statistical analysis. (E) Colony‐formation assay of Mel202 cells infected by vector control (vec) or BAP1‐targeting sgRNAs (g1, g2, and g3), and the colonies were stained with crystal violet for quantification. The data are presented as the mean ± SD (n = 3) from one representative experiment out of three. One‐way ANOVA followed by Tukey test was used for statistical analysis. (F) Population doublings (PD) of Mel270, OMM2.3, and Mel202 cells infected by vector control (vec) or BAP1‐targeting g2 sgRNA followed over 12 days. Immunoblots show the BAP1 protein level to confirm the BAP1 KO efficiency in the respective cell pool at the final time point (12 days). The data are presented as the mean ± SD (n = 3) from one representative experiment out of three. (G) Immunoblots show the BAP1 expression recovery during cell passages in Mel202 cells infected by BAP1‐targeting g3 sgRNA. The blots shown are representative of three independent experiments.

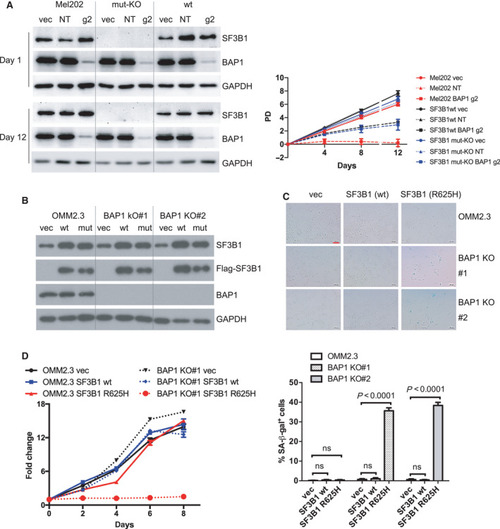
BAP1 deficiency combined with SF3B1 hotspot mutation induces senescence. (A) Growth curve of Mel202 cells with different SF3B1 mutation status infected by vector control (vec), non‐targeting sgRNA (NT), or BAP1‐targeting g2 sgRNA. Mel202 cells harbor heterozygous SF3B1 mutation, SF3B1 mut‐KO Mel202 cells contain out‐frame deletion of the mutant allele and p. His8_Glu9delinsGln in the wild‐type allele, and SF3B1 wt indicates re‐expression of the wild‐type SF3B1 in the SF3B1 mut‐KO cells. The data are presented as the mean ± SD (n = 3) from one representative experiment out of three. (B) Re‐expression of Flag‐tagged wt or mutant SF3B1 (R625H) in OMM2.3 and BAP1 KO clones. The blots shown are representative of three independent experiments. (C) Images show acidic senescence‐associated β‐galactosidase staining. The scale bar represents 100 μm. Graph represents the percentage of β‐galactosidase‐positive cells versus total cells (at least 200 cells were counted in random fields per group). The data are presented as the mean ± SD (n = 3) from one representative experiment out of three. One‐way ANOVA followed by Tukey test was used for statistical analysis. (D) Growth curve of OMM2.3 (solid lines) and OMM2.3 BAP1 KO#1 clone (dashed lines) infected with retrovirus encoding for wt or mutant SF3B1 (R625H). The data are presented as the mean ± SD (n = 6) from one representative experiment out of three.

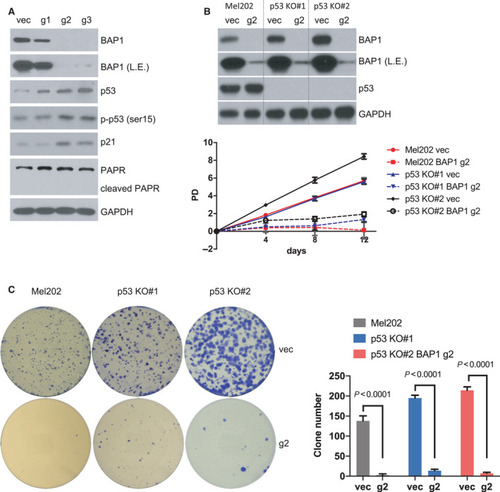
p53 is not required for the senescence phenotype. (A) Immunoblots show the expression of indicated proteins of Mel202 cells infected by vector control (vec) or BAP1‐targeting sgRNAs (g1, g2, and g3). The blots shown are representative of three independent experiments. (B) Growth curve of Mel202 and Mel202 p53 KO clones (#1 and #2) infected by vector control (vec) or BAP1‐targeting g2 sgRNA. Immunoblots show BAP1 KO efficiency at the final time point (12 days) in Mel202 and Mel202 p53 KO clones (#1 and #2). The data are presented as the mean ± SD (n = 3) from one representative experiment out of three. (C) Colony‐formation assay of Mel202 and Mel202 p53 KO clones (#1 and #2) infected by vector control (vec) or BAP1‐targeting g2 sgRNA, and the colonies were stained with crystal violet for quantification. The data are presented as the mean ± SD (n = 3) from one representative experiment out of three. Student’s t test was used for statistical analysis.

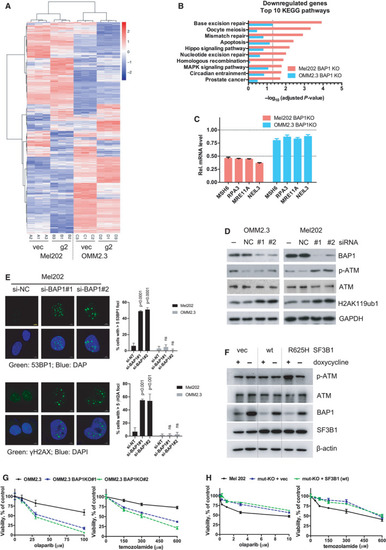
BAP1 deficiency combined with SF3B1 hotspot mutation induces DNA damage response. (A) RNA‐Seq data of differentially expressed genes (DEGs) in Mel202 and OMM2.3 cells with BAP1 KO (g2) compared with vector control (vec). Data were analyzed with DESeq2 (cutoff: adjusted P‐value < 0.05). Hierarchical clustering of the DEGs was used to display the log2‐fold changes. (B) KEGG pathways enrichment analysis for the downregulated DEGs displayed in the heatmap. Only the top 10 pathways exclusively enriched in Mel202 cells are shown. The bars represent the enrichment scores, ‐log10 (adjusted P‐value). (C) Expression of DNA‐repair genes was determined by qRT‐PCR after BAP1 KO in Mel202 and OMM2.3 cells. The change of gene expression was normalized to vec control. Error bars represent SD (n = 3). (D) Immunoblots show the effect of BAP1 knockdown by siRNA on p‐ATM, total ATM, and H2AK119ub1 in Mel202 and OMM2.3. The blots shown are representative of three independent experiments. (E) Knockdown of BAP1 by siRNA led to increased 53BP1 foci and γH2AX foci in Mel202 but not OMM2.3 cells. The scale bar represents 5 μm. Graphs show mean percentage of cells with > 5 53BP1 or γH2AX foci (more than 100 cells were counted in random fields per group). The data are presented as the mean ± SD (n = 3) from one representative experiment out of three. One‐way ANOVA followed by Tukey test was used for statistical analysis. (F) Immunoblots show the effect of inducible BAP1 knockdown on p‐ATM and total ATM in OMM2.3 cells stably expressing vector, wild‐type (wt) SF3B1, or mutant SF3B1 (R625H). Stable OMM2.3 cells expressing inducible BAP1‐targeting shRNA were established. These cells were then infected with retroviruses encoding for control vector, wild‐type SF3B1, or mutant SF3B1 (R625H). Cells were treated with doxycycline (200 ng·mL−1) for 72 h. The blots shown are representative of three independent experiments. (G) Effects of BAP1 KO on cell sensitivity to DNA damaging agents. Parental OMM2.3 or CRISPR‐mediated BAP1 KO clones (#1 and #2) were treated with olaparib or temozolamide with indicated concentrations for 6 days. Cell viability was determined by MTT assay. The data are presented as the mean ± SD (n = 3) from one representative experiment out of three. (H) Effects of SF3B1 mutation status on cell sensitivity to DNA damaging agents. Mel202 cells with different SF3B1 mutation status (heterozygous SF3B1 mutation, SF3B1 mut‐KO, and SF3B1 wt re‐expression in the mut‐KO cells) were treated with olaparib or temozolamide as indicated concentrations for 6 days. Cell viability was determined by MTT assay. The data are presented as the mean ± SD (n = 3) from one representative experiment out of three.

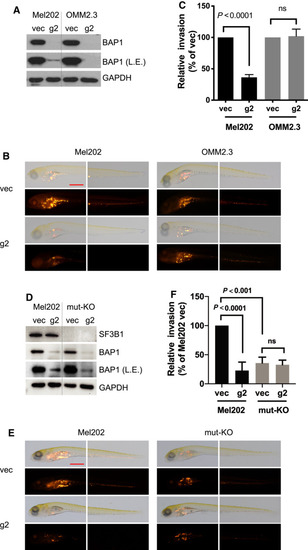
BAP1 deletion suppresses in vivo invasion of SF3B1‐mutated UM cells. (A) Immunoblots show BAP1 KO efficiency by lentivirus CRISPR‐Cas9. The blots shown are representative of three independent experiments. (B) Representative images at 6 days post‐injection (dpi) of vector and CRISPR‐mediated BAP1 KO Mel202/OMM2.3 heterogeneous cell pool engrafted into the yolk sac of zebrafish embryos. The images shown are representative of three independent experiments. The scale bar represents 500 μm. (C) Graphs show quantification of tumor cell invasion. All experiments consist of three independent repeats. For each independent experiment, at least 10 embryos were used in each group. Values of three independent experiments were given as mean ± SD. Student’s t test was used for statistical analysis. (D) Immunoblots show BAP1 KO efficiency by lentivirus CRISPR‐Cas9. The blots shown are representative of three independent experiments. (E) Representative images at 6 dpi of vector and CRISPR‐mediated BAP1 KO Mel202/Mel202 SF3B1 mut‐KO heterogeneous cell pool engrafted into the yolk sac of zebrafish embryos. The images shown are representative of three independent experiments. The scale bar represents 500 μm. (F) Graphs show quantification of tumor cell invasion. All experiments consist of three independent repeats. For each independent experiment, at least 10 embryos were used in each group. Values of three independent experiments were given as mean ± SD. Student’s t test was used for statistical analysis.

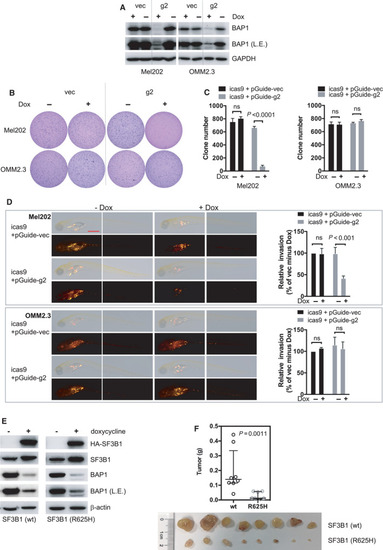
BAP1 deficiency combined with SF3B1 mutation suppresses in vivo invasion and growth of UM cells. (A) Immunoblots show BAP1 KO efficacy by inducible lentivirus CRIPSR‐Cas9. Stable Mel202 and OMM2.3 cell clones with Cas9 expression under doxycycline‐inducible promoter were selected. These Cas9‐expressing clones were then infected with lentivirus encoding for control vector (vec) or BAP1‐targeting sgRNA (g2). Cells were treated with doxycycline (200 ng·mL−1) for 6 days. The blots shown are representative of three independent experiments. (B) Soft‐agar colony‐formation assay of Mel202 and OMM2.3 cells upon inducible BAP1 deletion. Colonies were stained with crystal violet. The images shown are representative of three independent experiments. (C) Quantification of colonies. The data are presented as the mean ± SD (n = 3) from one representative experiment out of three. Student’s t test was used for statistical analysis. (D) Representative images at 6 dpi of parental and inducible CRISPR‐mediated BAP1 knockout Mel202 and OMM2.3 heterogeneous cell pool engrafted into the yolk sac of zebrafish embryos. The scale bar represents 500 μm. After injection, embryos were soaked in egg water containing doxycycline (10 μg·mL−1). Graphs show quantification of tumor cell invasion. All experiments consist of three independent repeats. For each independent experiment, at least 10 embryos were used in each group. Values of three independent experiments were given as mean ± SD. Student’s t test was used for statistical analysis. (E) Immunoblots show inducible BAP1 knockout and inducible expression of wild‐type or mutant SF3B1 (R625H) in OCM1 cells. Cells were treated with doxycycline (200 ng·mL−1) for 3 days, and BAP1 deletion and wild‐type/mutant SF3B1 were assessed by immunoblotting. The blots shown are representative of three independent experiments. (F) BAP1 knockout combined with mutant SF3B1 expression inhibits OCM1 tumor xenograft growth in vivo. The same cell lines used in (E) were grafted into nude mice subcutaneously, and tumor weight was quantified. Data are presented as median with interquartile range. n = 8 mice per group. The Mann–Whitney U‐test was used for statistical analysis.

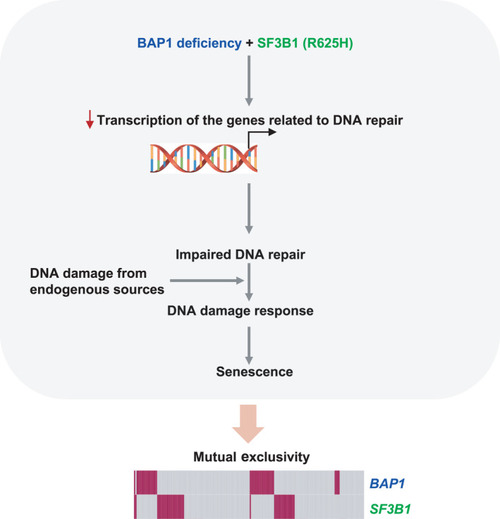
A proposed model accounting for the observed mutually exclusive pattern of BAP1 and SF3B1 mutations in UM. The transcriptional suppression of DNA‐repair genes derived from co‐occurrence of BAP1 deficiency and SF3B1 hotspot mutation (R625H) impairs cells’ capacity to buffer endogenous DNA damage and consequently leads to DNA damage and senescence. These data provide a functional explanation for the observed mutual exclusivity of BAP1 and SF3B1 mutations in UM.

Acknowledgments
This image is the copyrighted work of the attributed author or publisher, and ZFIN has permission only to display this image to its users. Additional permissions should be obtained from the applicable author or publisher of the image. Full text @ Mol. Oncol.