
- Title
-
Corpuscles of Stannius development requires FGF signaling
- Authors
- Klingbeil, K., Nguyen, T., Fahrner, A., Guthmann, C., Wang, H., Schoels, M., Lilienkamp, M., Franz, H., Eckert, P., Walz, G., Yakulov, T.A.
- Source
- Full text @ Dev. Biol.
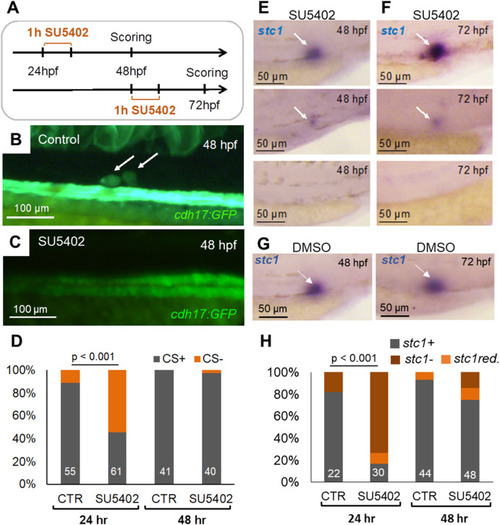
Inhibition of Fgf signaling with SU5402 prevents formation of the corpuscles of Stannius (CS). (A) Embryos were treated with the Fgf inhibitor SU5402 (25 μM) from 24 to 25 hpf or from 48 to 49 hpf. The CS formation and the stc1 expression were scored 24 h later, at 48 and 72 hpf, respectively. (B) An example of a control cdh17:GFP transgenic embryo at 48 hpf. Arrows point to properly formed CS. (C) An example of an embryo treated with SU5402 at 24 hpf, in which CS formation could not be detected at 48 hpf. (D) Inhibition of Fgf signaling with SU5402 (25 μM) from 24 to 25 h post fertilization (hpf) significantly reduced the number of embryos with formed CS, scored at 48 hpf (p < 0.001, Cochran-Mantel-Haenszel test). The treatment from 48 to 49 hpf had no effect. The numbers of scored embryos are shown within each bar. (E) Examples of embryos treated with SU5402 at 24 hpf with normal (top), strongly reduced (middle) or absent (bottom) stc1 expression at 48 hpf. (F) Examples of embryos treated with SU5402 at 48 hpf with normal (top), strongly reduced (middle) or absent (bottom) stc1 expression at 72 hpf. (G) Examples of control embryos treated with DMSO at 24 hpf (left) and 48 hpf (right) showing normal stc1 expression at 48 and 72 hpf respectively. (H) SU5402 (25 μM) treatment from 24 to 25 hpf eliminated stc1 expression (stc1-the percentage of zebrafish embryos without detectable stc1 expression, stc1 red. – the percentage of embryos with reduced stc1 expression; Cochran-Mantel-Haenszel test), while treatment from 48 to 49 hpf had only a marginal effect. The numbers of scored embryos are shown within each bar. |
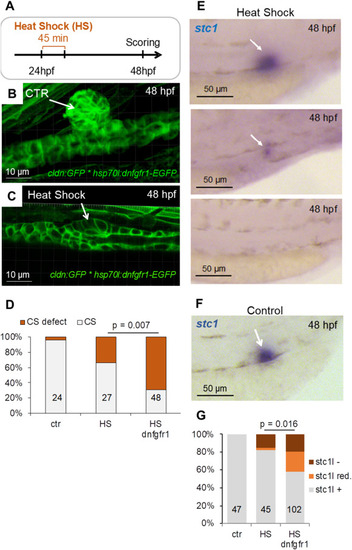
Inhibition of Fgf signaling, using a heat shock-inducible dominant negative Fgf receptor, prevents CS formation. (A) The cldn:GFP∗hsp70l:dnfgfr1-EGFP transgenic zebrafish line was used to induce dominant negative fgfr1 expression. Heat shock was induced at 24 hpf and 38 °C for 45 min and the CS development was evaluated 24 h later by confocal microscopy or whole mount in situ hybridization for stc1. (B) An example of normally developed CS in a CTR – control embryo that has not been heat-shocked. (C) An example of abnormally developed CS in a cldn:GFP∗hsp70l:dnfgfr1-EGFP embryo that has been heat-shocked. (D) Heat shock of cldn:GFP∗hsp70l:dnfgfr1-EGFP embryos increased the number of defective CS (left and middle bars; ctr – not heat-shocked embryos of the cldn:GFP∗hsp70l:dnfgfr1-EGFP line; HS - heat-shocked embryos of the cldn:GFP line). However, heat shock-induced expression of dnfgfr1 resulted in reduction of CS formation that was significantly different (p = 0.007, Cochran-Mantel-Haenszel test) from the effect caused by heat shock alone (HS dnfgfr1 - heat-shocked embryos of the cldn:GFP∗hsp70l:dnfgfr1-EGFP line). The numbers of scored embryos are shown within each bar. (E) Representative images of embryos with normal (top), strongly reduced (middle) or absent (bottom) stc1 expression after heat shock-induced expression of dnfgfr1. (F) An example of control (ctr) embryo of the cldn:GFP∗hsp70l:dnfgfr1-EGFP line that has not been heat-shocked showing normal expression of stc1. (G) Defective CS formation correlated with reduced stc1 expression after heat shock-induced expression of dnfgfr1 (p = 0.016, Cochran-Mantel-Haenszel test). The numbers of scored embryos are shown within each bar. ctr – not heat-shocked embryos of the cldn:GFP∗hsp70l:dnfgfr1-EGFP line; HS - heat-shocked embryos of the cldn:GFP line; HS dnfgfr1 - heat-shocked embryos of the cldn:GFP∗hsp70l:dnfgfr1-EGFP line. |
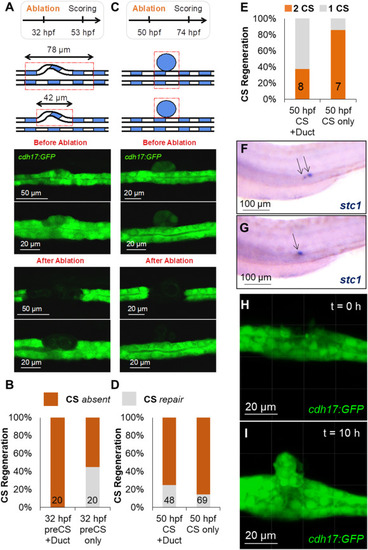
Laser-ablated corpuscles of Stannius (CS) can partially regenerate. (A) Laser ablation was used to destroy either the developing CS (preCS) together with the surrounding tubule (Duct) (78 μm), or only the developing CS (preCS) (42 μm) at 32 hpf. CS development was scored at 53 hpf. Top panel shows schematics of both setups. Middle panel shows the CS before ablation and the bottom panel shows the laser-ablated pronephric tubules. (B) Quantification of the experiments shown in (A). The numbers in the bars show the number of scored embryos. After the circumscribed 42 μm-laser ablation, GFP-positive material was detectable in 45% of the embryosthat likely represents regenerating CS. (C) Ablation of either CS plus the underlying tubule (CS + Duct), or selectively the CS (CS only) at 50 hpf. Scoring was done at 74 hpf. Top panel shows schematics of both setups. Middle panel shows the CS before ablation and the bottom panel shows the laser-ablated pronephric tubules. (D) Quantification of the experiments shown in (C). The numbers in the bars show the number of scored embryos. Some GFP-positive material was detectable in ca. 20%, likely representing newly formed CS. (E) Embryos with putative newly formed CS after ablation at 50 hpf were stained for stc1. In ca. 30% of the cases after CS + duct ablation and ca. 90% of the cases where only the CS was ablated two CS were detectable. (F) An example of embryo with two stc1 positive CS (arrows) after ablation as described in (E). (G) An example of embryo with one stc1 positive CS (arrows) after ablation as described in (E). (H) A still image from a time lapse of CS regeneration showing the pronephric tubule after CS ablation at 50 hpf. (I) A still image from a time lapse of CS regeneration showing the regenerated CS at 10 h post ablation as described in (H). |

Expression pattern of zebrafish stanniocalcin 1 (stc1), adenomatosis polyposis coli down-regulated 1-like (apcdd1l), cadherin 16/ksp cadherin (cdh16), frizzled related protein (frzb),convertase subtilisin/kexin type 2 (pcsk2) and prickle homolog 3 (prickle3) during zebrafish embryogensis. (A) Zebrafish stc1 is expressed at 24 h post fertilization (hpf) at the end of the pronephros. With the development of the corpuscles of Stannius (CS), the expression is confined to the CS, where it is highly expressed during the first days of development. (B) Zebrafish apcdd1l co-localizes with the CS at 24 and 72 hpf. (C) Zebrafish cdh16 is expressed along most segments of the pronephros during early development, but primarily localizes with the corpuscles of Stannius (CS) at 48 hpf. (D) Zebrafish frzb is also expressed in several distal regions of the pronephros during early stages of development, but becomes confined to the CS at 48 and 72 hpf. (E) Zebrafish pcsk2 is prominently expressed in the corpuscles of Stannius (CS) at 48 hpf. A comparison of the expression levels derived from the single-cell RNA sequencing with the closely related furin a (pcsk3) and carboxypeptidase E (cpe) suggests a transient expression of cpe at 2 days post fertilization (dpf), followed by increased expression of pcsk2/3. (F) Zebrafish prickle3 co-localizes with the CS at 48 and 72 hpf. |

Stimulation of canonical Wnt signaling inhibits stc1 expression. (A) The Wnt agonist BIO (0.5 μM), added to zebrafish embryos from 32 to 48 h post fertilization (hpf), decreased stc1 expression, while the Wnt inhibitor IWR-1 (20 μM) had no effect. Control zebrafish embryos (CTR) were treated with solvent (DMSO). (B) Quantification of the intensity after addition of BIO from 32 to 48 hpf revealed a significant decrease of stc1 expression at 0.5 and 1.0 μM, while IWR-1 at 10 and 20 μM had no effect (Student's t-test; Mean and standard error of the mean are shown in red). The numbers inside the brackets represent the number of analyzed embryos. (C) Addition of BIO and IWR-1 from 56 to 72 hpf had only a marginal effect on stc1 expression. (D) Quantification of the in situ hybridization intensity after addition from 56 to 72 hpf showed no effect on stc1 expression of either BIO or IWR-1 (Student's t-test; Mean and standard error of the mean are shown in red). The numbers inside the brackets represent the number of analyzed embryos. |
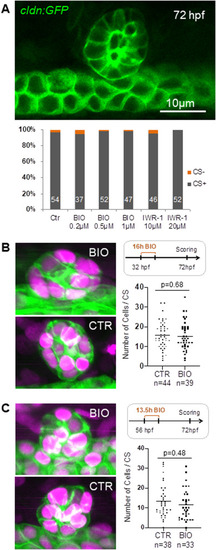
Wnt signaling does not affect CS formation. (A) Zebrafish embryos were treated from 32 to 48 h post fertilization with the Wnt agonist BIO (0.2–1 μM) or the Wnt inhibitor IWR-1 (10–20 μM). The presence or absence of CS was scored at 48 hpf. Stimulation or inhibition of canonical Wnt signaling did not affect CS formation. Top panel shows normally developed CS at 72 hpf. Bottom panel shows the quantification of CS development. The numbers of analyzed embryos are shown inside the bars. Ctr – DMSO-treated control embryos. (B) To determine whether Wnt alters the number of cells within the CS, zebrafish embryos of the line Tg(-8.0cldnb:LY-EGFP), TgBAC(cxcr4b:H2B-RFP) were treated with 1 μM BIO at 32 hpf as indicated in the upper right panel. The left panels show images of normally developed CS from the DMSO-treated (CTR, control) group (bottom) and the BIO-treated (BIO) group (top). Cells, counted at 72 hpf, were not significantly affected by Wnt activation (Student's t-test). Magenta: nuclei labeled with H2B:RFP. Green: cells labeled with cldn:GFP (C) BIO exposure starting at 56 hpf as indicated also had no effect on CS cell numbers (p-values were calculated using Student's t-test). The left panels show images of normally developed CS from the DMSO-treated (CTR, control) group (bottom) and the BIO-treated (BIO) group (top). The numbers of analyzed embryos are shown underneath. |
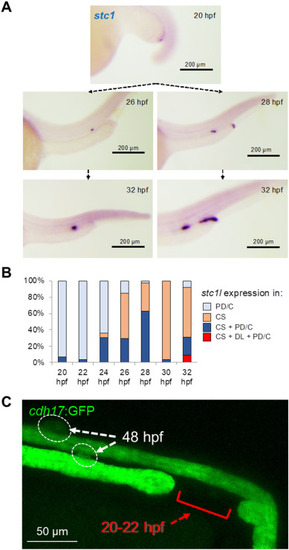
Expression of stc1 in the distal pronephros does not contribute to CS formation. (A) Analysis of stc1 expression at different developmental stages revealed natural variability in the stc1 expression. At 20 hpf stc1 was expressed in the distal pronephric duct (PD) and cloaca region. In some embryos stc1 expression was subsequently confined to the CS at later stages (left panel). However, in other embryos stc1 was also expressed outside of the CS, including the distal late tubule (DL). (B) The graph shows the percentage of embryos with stc1 expression in pronephric duct/cloaca (PD/C), corpuscles of Stannius (CS), corpuscles of Stannius and pronephric duct/cloaca (CS + PD/C), corpuscles of Stannius and distal late tubule, and pronephric duct/cloaca (CS + DL + PD/C). At 32 hpf, more than 30% of embryos expressed stc1 outside of the CS. (C) To exclude the possibility that pronephric duct cells expressing stc1 are recruited to the CS, the pronephric duct was disrupted by a 30 μm laser-induced injury at 20–22 hpf. Normal CS development occurred in all injured embryos that did not repair the gap (n = 7). |
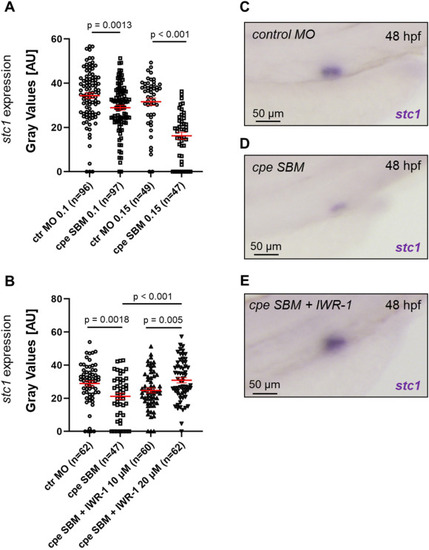
Depletion of zebrafish carboxypeptidase E (cpe) reduces stc1 expression. (A) Quantification of the in situ hybridization intensity after depletion of cpe with a splice-blocking (SBM) morpholino oligonucleotide (MO). ctr MO – control morpholino oligonucleotide. The numbers of analyzed embryos are shown inside the brackets. Depletion of cpe significantly reduces stc1 expression. (B) Quantification of the in situ hybridization intensity. The reduced stc1 expression after depletion of cpe with the SBM (0.1 mM) is rescued by the Wnt antagonist IWR-1 in dose-dependent fashion (ctr MO, control MO, 0.1 mM). The numbers of analyzed embryos are shown inside the brackets. (C) An example of stc1 expression in embryo injected with control MO that was quantified in (A). (D) An example of stc1 expression in embryo injected with cpe SBM that was quantified in (A). (E) An example of stc1 expression in embryo injected with cpe SBM and treated with IWR-1 that was quantified in (B). p-values were calculated using Cochran-Mantel-Haenszel test. Error bars represent standard error of the mean. |
Reprinted from Developmental Biology, 481, Klingbeil, K., Nguyen, T., Fahrner, A., Guthmann, C., Wang, H., Schoels, M., Lilienkamp, M., Franz, H., Eckert, P., Walz, G., Yakulov, T.A., Corpuscles of Stannius development requires FGF signaling, 160-171, Copyright (2021) with permission from Elsevier. Full text @ Dev. Biol.