
- Title
-
Pax2a, but not pax2b, influences cell survival and periocular mesenchyme localization to facilitate zebrafish optic fissure closure
- Authors
- Lusk, S., Kwan, K.M.
- Source
- Full text @ Dev. Dyn.
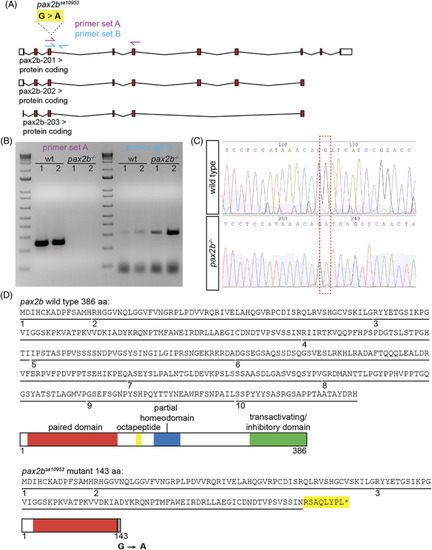
The pax2b sa10953 allele contains an essential splice site variant causing retention of intron 3/4 and a premature stop codon. (A) Using the zebrafish GRCz11 genome assembly, the pax2b gene is found on Chromosome 12: 45,799,982 to 45,876,387. Schematized are three predicted transcripts; the pax2b sa10953 allele contains a G > A mutation at site Chr 12:45872685 that is predicted to affect all transcripts. This schematic is shown reflected compared to the genomic organization for ease of interpretation, as pax2b lies on the reverse strand. Untranslated regions are depicted as white boxes, exons as red boxes, and introns as connecting lines. Two primer pairs are represented as arrows: primer set A (magenta) is located such that the forward primer is within exon 3 and the reverse primer is within exon 5; primer set B (cyan) has a forward primer in exon 3 and reverse primer in intron 3/4. (B) Image of an agarose gel containing RT‐PCR products for each primer set using wild‐type and pax2b sa10953 homozygous mutant cDNA. Using wild‐type cDNA, primer set A amplifies a band with a predicted size of 279 base pairs. There is no amplification detected using pax2b sa10953 mutant cDNA, but the predicted size of this band is 21,718 base pairs. Using primer set B (predicted size of 346 base pairs), there is a faint band with wild‐type cDNA and a stronger band with pax2b sa10953 mutant cDNA. (C) Sanger sequencing chromatograms for PCR products from wild‐type and pax2b sa10953 homozygous mutant cDNA, cropped to show the mutation in pax2b sa10953 (red box). Downstream of the G > A site in the wild type is the sequence of exon 4, while the pax2b mutant contains the sequence of intron 3/4. (D) The predicted protein sequence for wild‐type pax2b and the pax2b sa10953 allele. Each exon is underlined and numbered. Schematic displays the domains in the wild‐type pax2b protein. In the pax2b sa10953 mutant, the disruption of the splice site junction leads to inclusion of amino acids from within intron 3/4 and an early stop codon (yellow, and asterisk). Schematic displays the predicted domains of the truncated pax2bsa10953 protein |
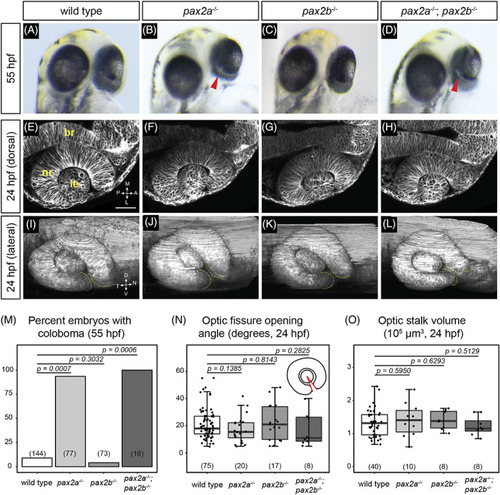
pax2a and pax2a; pax2b loss‐of‐function mutants display coloboma, but optic cup morphogenesis appears normal. (A‐D) Eye phenotypes at 55 hpf. (A) Wild‐type embryo. (B) pax2a tu29a mutant embryo; coloboma is apparent as a region of hypopigmentation at the back of the eye (red arrowhead). (C) pax2b sa10953 mutant embryo; the eye is evenly pigmented, there is no apparent coloboma. (D) pax2a tu29a ; pax2b sa10953 mutant embryo; coloboma is apparent (red arrowhead). (E‐L) Optic cup phenotypes at 24 hpf. (E) Wild‐type, (F) pax2a tu29a mutant, (G) pax2b sa10953 mutant, (H) and pax2a tu29a ; pax2b sa10953 mutant optic cup formation, single confocal slices. Dorsal view. Cell membranes, grayscale [Tg(bactin2:EGFP‐CAAX)]. (I) Wild‐type, (J) pax2a tu29a mutant, (K) pax2b sa10953 mutant, (L) and pax2a tu29a ; pax2b sa10953 mutant optic cup formation, three‐dimensional rendering. Lateral view. Cell membranes, grayscale [Tg(bactin2:EGFP‐CAAX)]. Yellow dashed lines indicate optic fissure margins. (M) Penetrance of coloboma phenotype, 55 hpf. n (embryos) shown at base of graphs. (N) Quantification of optic fissure opening angle measurement, 24 hpf. n (embryos) shown at base of graphs. Schematic depicts the optic fissure opening angle measurement in which each ray (red) originates at the margins of the optic fissure and the vertex lies in the center of the lens. (O) Quantification of optic stalk volume, 24 hpf. n (embryos) shown at base of graphs. P‐values for (M‐O) were calculated using an unpaired Student's t‐test. br, brain; le, lens; nr, neural retina. Scale bar: 50 μm |
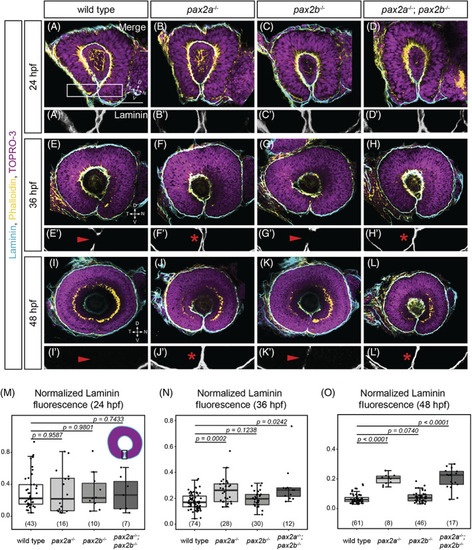
The optic fissure basement membrane fails to break down in pax2a and pax2a; pax2b mutants. Whole‐mount staining for Laminin (cyan), F‐actin (yellow, phalloidin), and nuclei (magenta, TO‐PRO‐3) at 24 hpf (A‐D), 36 hpf (E‐H), and 48 hpf (I‐L). Zoomed views of the optic fissure (A'‐L', from boxed region (as shown in A) show Laminin alone (grayscale). All images are lateral views, single optical sections. (A) Wild‐type, (B) pax2a tu29a , (C) pax2b sa10953 , (D) and pax2a tu29a ; pax2b sa10953 embryos at 24 hpf. (A'‐D′) Zoomed views of Laminin staining alone, showing Laminin staining in the optic fissure in all genotypes. (E) Wild‐type, (F) pax2a tu29a , (G) pax2b sa10953 , and (H) pax2a tu29a ; pax2b sa10953 embryos at 36 hpf. (E', G') Zoomed views of Laminin staining; staining is missing in wild‐type and pax2b sa10953 mutant optic fissures (red arrowheads). (F′, H′) Zoomed views of Laminin staining, which persists and completely lines the optic fissure (red asterisks) in pax2a tu29a and pax2a tu29a ; pax2b sa10953 mutants. (I) Wild‐type, (J) pax2a tu29a , (K) pax2b sa10953 , and (L) pax2a tu29a ; pax2b sa10953 embryos at 48 hpf. (I′, K′) Zoomed views of Laminin staining; staining is largely absent in wild‐type and pax2b sa10953 mutant optic fissures (red arrowheads). (J', L') Zoomed views of Laminin staining, which continues to completely line the optic fissure in pax2a tu29a and pax2a tu29a ; pax2b sa10953 mutants (red asterisk). (M‐O) Quantification of Laminin fluorescence intensity normalized to TO‐PRO‐3 at a single mid‐depth section using an ROI around the optic fissure, 24 hpf (M); 36 hpf (N); and 48 hpf (O). n (embryos) shown at base of graphs. P‐values for (M‐O) were calculated using an unpaired Student's t‐test. Schematic (M) shows the region where the ROI was placed for quantification of the fluorescence intensity. Scale bar: 50 μm |

Tg(sox10:GFP)‐positive neural crest cells properly localize in the optic fissure, but persist in pax2a and pax2a; pax2b mutants. Embryos visualized for neural crest (green; Tg(sox10:GFP)) and cell membranes (magenta; mCherry‐CAAX) at 24 hpf (A‐D), 36 hpf (E‐H), and 48 hpf (I‐L). All images are lateral views of three‐dimensional renderings. (A) Wild‐type, (B) pax2a tu29a , (C) pax2b sa10953 , (D) and pax2a tu29a ; pax2b sa10953 embryos at 24 hpf. GFP‐positive cells are located within the fissure in each genotype (yellow arrowheads). (E) Wild‐type, (F) pax2a tu29a , (G) pax2b sa10953 , (H) and pax2a tu29a ; pax2b sa10953 mutant embryos at 36 hpf. (I) Wild‐type, (J) pax2a tu29a , (K) pax2b sa10953 , (L) and pax2a tu29a ; pax2b sa10953 mutant embryos at 48 hpf. (M‐O) Quantification of GFP‐positive cells throughout the depth of the optic fissure within the optic cup, 24 hpf (M); 36 hpf (N); and 48 hpf (O). n (embryos) shown at base of graphs. P‐values for (M‐O) were calculated using an unpaired Student's t‐test. Schematic (M) shows the region of the optic fissure through the optic cup in which transgene‐positive cells were quantified |
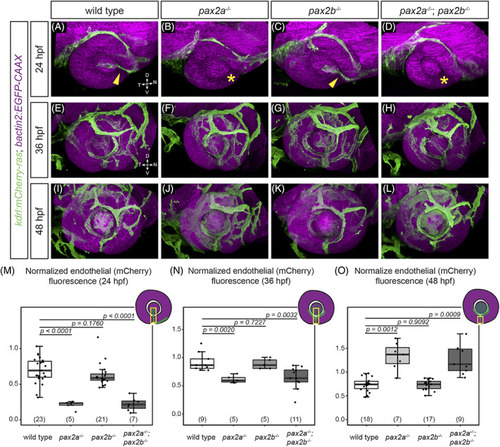
POM‐derived endothelial cells do not properly populate the optic fissure in pax2a and pax2a; pax2b mutants. Embryos visualized for endothelial cells (green; Tg(kdrl:mCherry‐ras)) and cell membranes (magenta; Tg(bactin2:EGFP‐CAAX)) at 24 hpf (A‐D), 36 hpf (E‐H), and 48 hpf (I‐L). All images are lateral views of three‐dimensional renderings. (A) Wild‐type, (B) pax2a tu29a , (C) pax2b sa10953 , (D) and pax2a tu29a ; pax2b sa10953 embryos at 24 hpf. kdrl transgene‐positive cells are located within the fissure (yellow arrowhead) and behind the lens in (A) wild‐type and (C) pax2b sa10953 . kdrl transgene‐positive cells are absent from this region (yellow asterisk) in (B) pax2a tu29a and (D) pax2a tu29a ; pax2b sa10953 mutants. (E) Wild‐type, (F) pax2a tu29a , (G) pax2b sa10953 , (H) and pax2a tu29a ; pax2b sa10953 mutant embryos at 36 hpf. (I) Wild‐type, (J) pax2a tu29a , (K) pax2b sa10953 , (L) and pax2a tu29a ; pax2b sa10953 mutant embryos at 48 hpf. In contrast to 24 hpf, (J) pax2a tu29a and (L) pax2a tu29a ; pax2b sa10953 mutants show increased POM‐derived endothelial cells in the fissure region. (M‐O) Quantification of endothelial cell (mCherry) fluorescence intensity normalized to GFP in a region of a maximum intensity projection of the optic fissure, 24 hpf (M); 36 hpf (N); and 48 hpf (O). n (embryos) shown at base of graphs. P‐values for (M‐O) were calculated using an unpaired Student's t‐test. (M‐O) Schematics show the specific region where the ROI was placed on the projected image for quantification of fluorescence intensity at 24 (M) and 36 hpf (N); the ROI did not include the lens region for quantification of fluorescence intensity at 48 hpf (O) |

Minimal apoptotic cell death is observed in the optic fissure, but is increased in the MHB and POM in pax2a and pax2a; pax2b mutants. Whole‐mount immunofluorescence for cell death (green; activated Caspase‐3) and nuclei (magenta; TO‐PRO‐3) at 24 hpf (A‐D), 36 hpf (E‐H), and 48 hpf (I‐L). All images are lateral views of three‐dimensional renderings. (A) Wild‐type, (B) pax2a tu29a , (C) pax2b sa10953 , (D) and pax2a tu29a ; pax2b sa10953 embryos at 24 hpf. (E) Wild‐type, (F) pax2a tu29a , (G) pax2b sa10953 , (H) and pax2a tu29a ; pax2b sa10953 embryos at 36 hpf. (I) Wild‐type, (J) pax2a tu29a , (K) pax2b sa10953 , (L) and pax2a tu29a ; pax2b sa10953 embryos at 48 hpf. White arrowheads, examples of cells labeled with activated Caspase‐3 elsewhere in the optic cup, brain, or POM. (M‐O) Quantification of total number of activated Caspase‐3‐positive cells throughout the depth of the optic fissure within the optic cup, at 24 hpf (M); 36 hpf (N); and 48 hpf (O). n (embryos) shown at base of graphs. P‐values for (M‐O) were calculated using an unpaired Student's t‐test. Schematic (M) shows the specific region of the optic fissure through the optic cup in which activated Caspase‐3‐positive cells were quantified. (P) Table summarizing number of embryos at 24 hpf containing five or more activated Caspase‐3‐positive cells located in the forebrain, MHB, and POM for each genotype. mhb, midbrain‐hindbrain boundary; pom, periocular mesenchyme; fb, forebrain |

Inhibition of apoptosis with Bcl‐xL RNA rescues cell death within the MHB and POM and partially rescues coloboma in pax2a and pax2a; pax2b mutants. (A‐D) Whole‐mount immunofluorescence for cell death (green; activated Caspase‐3) and nuclei (magenta; TO‐PRO‐3) at 24 hpf for (A) wild‐type, (B) pax2a tu29a , (C) pax2b sa10953 , (D) and pax2a tu29a ; pax2b sa10953 mutant embryos injected with 100 pg Bcl‐xL RNA. Images are lateral views of three‐dimensional renderings. (E) Quantification of total number of activated Caspase‐3‐positive cells throughout the depth of the optic fissure within the optic cup in Bcl‐xL‐injected embryos, 24 hpf. n (embryos) shown at base of graphs. Schematic (E) shows the region of the optic fissure through the optic cup in which activated Caspase‐3‐positive cells were quantified. (F) Table summarizing number of Bcl‐xL‐injected embryos at 24 hpf containing five or more activated Caspase‐3‐positive cells located in the forebrain, MHB, and POM for each genotype. (G‐J) Phenotype of (G) wild‐type, (H) pax2a tu29a , (I) pax2b sa10953 , (J) and pax2a tu29a ; pax2b sa10953 mutant embryos injected with Bcl‐xL RNA at 55 hpf. In each example, the eye is evenly pigmented and does not exhibit coloboma. Zoomed insets show the optic nerve head and medial optic fissure where closure has occurred in each genotype. The fraction in the bottom right corner represents the number of embryos without coloboma over the total number of embryos for each genotype. (K) Penetrance of coloboma phenotype in uninjected embryos (light gray bars) compared to embryos injected with 100 pg Bcl‐xL RNA (dark gray bars), 55 hpf. n (embryos) shown at base of graphs. P‐values were calculated using an unpaired Student's t‐test |