
- Title
-
Loss of Ift74 Leads to Slow Photoreceptor Degeneration and Ciliogenesis Defects in Zebrafish
- Authors
- Zhu, P., Xu, J., Wang, Y., Zhao, C.
- Source
- Full text @ Int. J. Mol. Sci.

ZFIN is incorporating published figure images and captions as part of an ongoing project. Figures from some publications have not yet been curated, or are not available for display because of copyright restrictions. |
|
ZFIN is incorporating published figure images and captions as part of an ongoing project. Figures from some publications have not yet been curated, or are not available for display because of copyright restrictions. PHENOTYPE:
|
|
ZFIN is incorporating published figure images and captions as part of an ongoing project. Figures from some publications have not yet been curated, or are not available for display because of copyright restrictions. |

michelin encodes a zebrafish homolog of the ift74 gene. (A,B) External phenotypes of wild-type (wt) and michelin mutants at 5 dpf. (C) Bar graph showing the percentages of embryos with body curvature defects in different groups as indicated. SP, splicing morpholino; ATG, translation-blocking morpholino. (D) Genetic map on LG 5 showing the number of recombinants near michelin/ift74 locus. The exon/intron structure of the ift74 transcript was shown in the middle. Bottom showing the sequence of wild-type and ift74 mutants generated with CRISPR/Cas9 methods. The sgRNA targeting site was indicated with overline, the PAM site was labeled in green and the changing bases in the target region were shown in red. (E) PCR analysis showing the amplification of ift74 ORF in 3 dpf wild-type, sibling, and michelin mutant larvae. (F–H) External phenotypes of 5 dpf ift74 mutant and morphant larvae as indicated. Scale bars: 500 µm. PHENOTYPE:
|
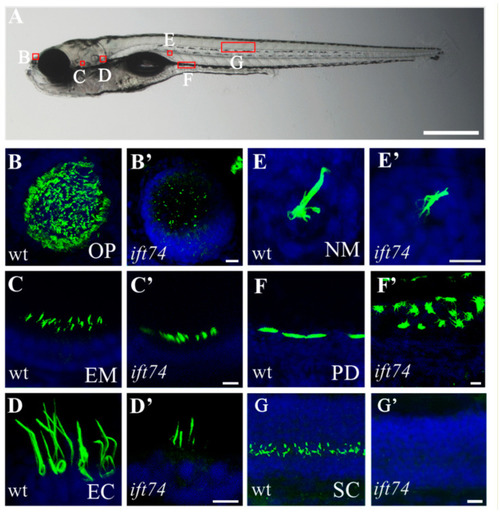
Cilia defects in ift74 mutants. (A) Representative image showing the position of cilia in different organs as indicated in a 5 dpf zebrafish larva. (B–G′) Confocal images showing cilia in different organs of wild-type and ift74 mutants as indicated. Cilia were visualized with anti-glycylated tubulin antibody (green), and nuclei were counterstained with DAPI (blue). OP, olfactory placode; EM, ear macula; EC, ear crista; NM, neuromast; PD pronephric duct; SC, spinal canal. Scale bars: (A), 500 µm; (B′–G′), 10 µm. |

Slow photoreceptor degeneration in ift74 mutants. (A) Confocal images showing the cell bodies of red and green double cones in wild-type and ift74 mutant larvae at different stages as indicated. The double cones were stained with zpr-1 antibody (green), and nuclei were stained with DAPI (blue). Enlarged views of the boxed area are shown on the right. (B,C) Statistical results showing the number of cones per retina section and length of cone cell body in different groups as indicated. Measurements of the cell body length are shown in panel (A) (Red square brackets). Scale bars: 20 µm. **** p < 0.0001, ns, no significant. |
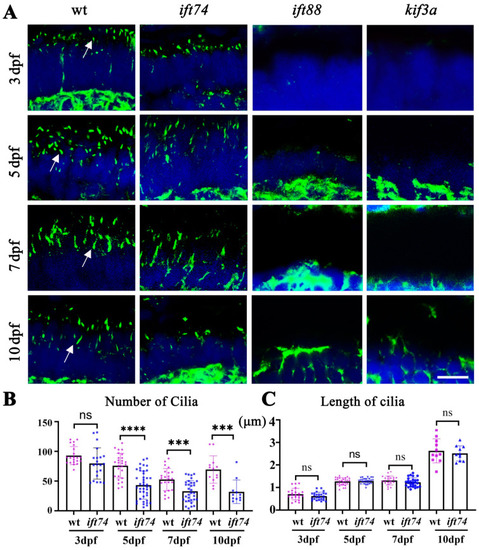
Photoreceptor connecting cilia in ift74, ift88, and kfi3a mutants. (A) Confocal images showing photoreceptor connecting cilia in the retinae of wild-type and mutant larvae at different stages as indicated. Cilia were stained with anti-acetylated alpha tubulin antibody (green). Arrows indicate the connecting cilia. (B,C) Dot plots showing the number and length of connecting cilia in different groups as indicated. Scale bar: 10 µm. *** p < 0.001, **** p < 0.0001, ns, no significant. EXPRESSION / LABELING:
PHENOTYPE:
|

Opsin transport analysis in ift74 mutant. (A–D) Representative confocal images of transverse cryosections through the central retinae of wild-type and ift74 mutant larvae at 4 and 24 h after heat-shock induction. The subcellular distribution of the GFP-CT44 (green) was evaluated. Sections were counterstained with phalloidin (red) to visualize the outer limiting membrane and the outer plexiform layer. Cell nuclei were stained with DAPI in blue. (E) Relative GFP fluorescence intensity in the cell bodies measured between the outer limiting membrane and the outer plexiform layer. Asterisks indicate outer segments; arrowheads indicate the outer limiting membrane and arrows indicate the outer plexiform layer. Scale bar: 10 µm. **** p < 0.0001, ns, no significant. |
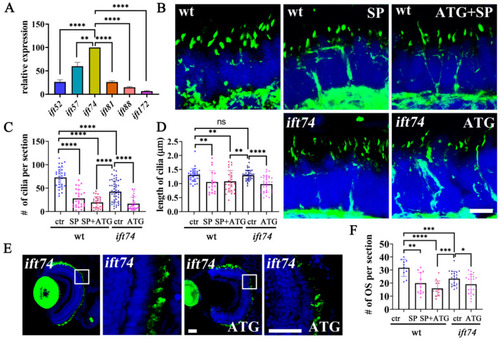
Maternal Ift74 contributes to the slow photoreceptor degeneration. (A) qRT-PCR results showing relative expression level of ift-b genes in one-cell stage embryos. The expression of the ift74 gene was set as 100%. (B) Confocal images showing photoreceptor connecting cilia in the retinae of 5 dpf wild-type, ift74 morphants, and mutant larvae. Cilia were stained with anti-acetylated alpha tubulin antibody (green). (C,D) Dot plots showing the number and length of connecting cilia in different groups as indicated. (E) Confocal images showing rod outer segments visualized with zpr-3 antibody in 5 dpf ift74 mutants injected with control or ATG morpholino as indicated. Enlarged views of the boxed area are shown on the right. (F) Statistical results showing the number of outer segments per retina section in different groups as indicated. Scale bars: B, 5 µm; E, 30 µm. * p < 0.05, ** p < 0.01, *** p < 0.001, **** p < 0.0001, ns, no significant. |