
- Title
-
Fisetin Inhibits NLRP3 Inflammasome by Suppressing TLR4/MD2-Mediated Mitochondrial ROS Production
- Authors
- Molagoda, I.M.N., Athapaththu, A.M.G.K., Choi, Y.H., Park, C., Jin, C.Y., Kang, C.H., Lee, M.H., Kim, G.Y.
- Source
- Full text @ Antioxidants (Basel)
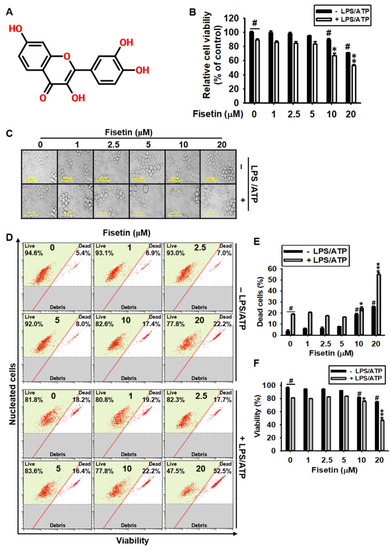
High concentrations of fisetin are cytotoxic to BV2 microglial cells. (A) Chemical structure of fisetin. BV2 microglial cells were treated with the indicated concentrations of fisetin (0–20 µM) for 2 h in the presence or absence of 1 µg/mL LPS for 2 h, followed by treatment with 1 mM ATP (LPS/ATP) for 24 h. (B) Cell viability was analyzed using an MTT assay. (C) Images of the cells were captured using phase-contrast microscopy (×10). (D) The population of dead and viable cells (%) was measured using a Muse Cell Count & Viability Kit. (E,F) Graphical representation of the population of (E) dead and (F) viable cells. The results indicate the mean ± standard error median (SEM), and is representative of the results obtained from three independent experiments. # p < 0.05 vs. untreated cells; *** p < 0.001, ** p < 0.01, and * p < 0.05 vs. LPS/ATP-treated cells. |
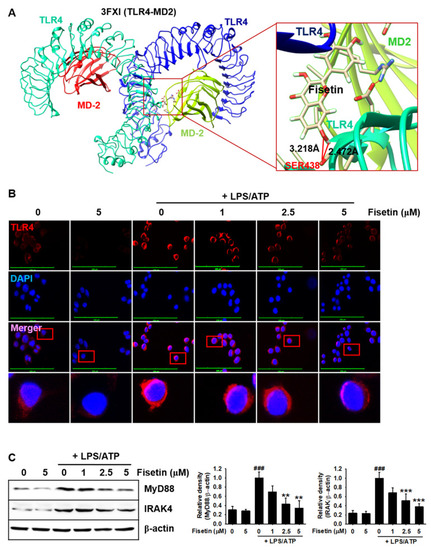
Fisetin probably binds to TLR4 and inhibits the TLR4-mediated intracellular signaling pathway. (A) Molecular docking of fisetin (pose 1) with the TLR4/MD2 complex (PDB ID: 3FXI). (B) BV2 microglial cells were seeded on 3% gelatin-coated coverslips and treated with the indicated concentrations of fisetin (0–5 µM) for 2 h prior to stimulation with 1 µg/mL LPS for 2 h and subsequent stimulation with 1 mM ATP (LPS/ATP) for an additional 2 h. Cells were fixed with 4% paraformaldehyde and immunostained for TLR4 using Alexa Fluor 647-conjugated secondary antibody. The images were captured using a CELENA S Digital Imaging System. (C) In a parallel experiment, the total proteins were extracted and western blotting was performed for detecting the expression of MyD88 and IRAK4 proteins. β-Actin was used as a loading control. The results indicate the mean ± standard error median (SEM), and is representative of the results obtained from three independent experiments. ### p < 0.001 vs. untreated cells; *** p < 0.001 and ** p < 0.01 vs. LPS/ATP-treated cells. |
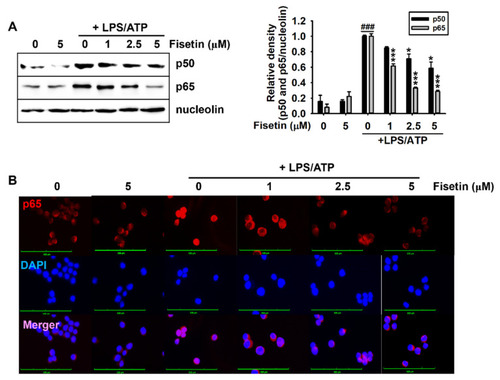
Fisetin inhibits the nuclear translocation of NF-κB. BV2 microglial cells were treated with the indicated concentrations of fisetin (0–5 µM) for 2 h and subsequently stimulated with 1 µg/mL LPS for 2 h, followed by stimulation with 1 mM ATP (LPS/ATP). (A) Nuclear proteins were extracted after 1 h of treatment with ATP and western blotting was performed. Nucleolin was used as a loading control. Relative densities of p50 and p65 were calculated using ImageJ software. (B) In a parallel experiment, the cells were fixed with 4% paraformaldehyde and immunostained for p65 with Alexa Fluor 647-conjugated secondary antibody. The images of the cells were captured using a CELENA S Digital Imaging System. The results indicate the mean ± standard error median (SEM), and is representative of the results obtained from three independent experiments. ### p < 0.001 vs. untreated cells; *** p < 0.001 and * p < 0.05 vs. LPS/ATP-treated cells. |
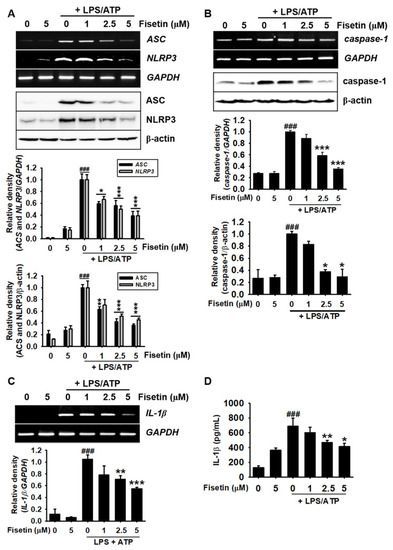
Fisetin inhibits the maturation of IL-1β by suppressing the formation of the NLRP3 inflammasome. BV2 microglial cells were treated with the indicated concentrations of fisetin (0–5 µM) for 2 h prior to stimulation with 1 µg/mL LPS for 2 h and subsequent stimulation with 1 mM ATP (LPS/ATP). (A–C) Total RNA was extracted after 9 h of treatment and total proteins were extracted after 18 h, following which RT-PCR (top) and western blotting (bottom) were performed. Relative densities were calculated using ImageJ software. (D) In a parallel experiment, cell culture media were collected after 48 h and the extracellular levels of IL-1β were quantified using ELISA. The results indicate the mean ± standard error median (SEM), and is representative of the results obtained from three independent experiments. ### p < 0.001 vs. untreated cells; *** p < 0.001, ** p < 0.01, and * p < 0.05 vs. LPS/ATP-treated cells. |
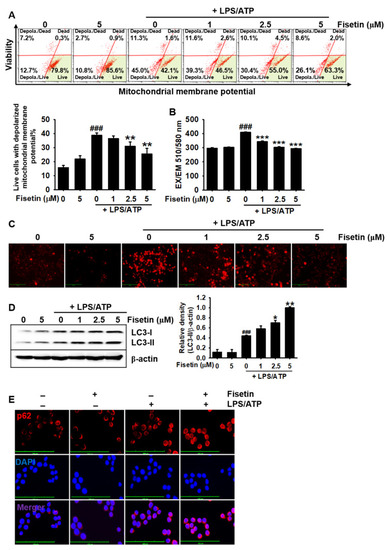
Fisetin inhibits mitochondrial membrane depolarization and promotes mitophagy. BV2 microglial cells were treated with the indicated concentrations of fisetin (0–5 μM) for 2 h and subsequently stimulated with 1 µg/mL LPS for 2 h, followed by stimulation with 1 mM ATP (LPS/ATP) for an additional 2 h. (A) Populations of depolarized mitochondria were measured using a Muse MitoPotential Kit. (B,C) Cells were stained with 2 µM MitoSOX Red for 10 min and (B) fluorescence intensities were measured using fluorometry. (C) Images of cells were captured using a CELENA S Digital Imaging System. (D) In a parallel experiment, total proteins were extracted after 9 h of treatment with LPS/ATP. Western blotting was performed for detecting the expression of LC3. β-Actin was used as a loading control. (E) Cells were fixed with 4% paraformaldehyde and immunostained for p62 with Alexa Fluor 647-conjugated secondary antibody. The results indicate the mean ± standard error median (SEM), and is representative of the results obtained from three independent experiments. Images were captured using a CELENA S Digital Imaging System. ### p < 0.001 vs. untreated cells; *** p < 0.001, ** p < 0.01 and * p < 0.05 vs. LPS/ATP-treated cells. |

Transient knockdown of p62 aggravates the fisetin-induced stabilization of mitochondrial membrane potential. BV2 microglial cells were transiently transfected with p62 siRNA (sip62) for 48 h and subsequently treated with 1 µg/mL LPS for 2 h, followed by stimulation with 1 mM ATP (LPS/ATP) for 2 h. (A) The population of cells with depolarized mitochondrial membrane potential was measured using a Muse MitoPotential Kit. The total population of live cells with depolarized mitochondrial membrane potential (bottom left) and cell viability (bottom right) is depicted. (B) In a parallel experiment, cells were stained using 2 µM MitoSOX Red. Images of cells were captured using a CELENA S Digital Imaging System. (C) Extracellular level of IL-1β were quantified using ELISA after 48 h of stimulation of LPS/ATP. The results indicate the mean ± standard error median (SEM), and is representative of the results obtained from three independent experiments.* p < 0.05. |
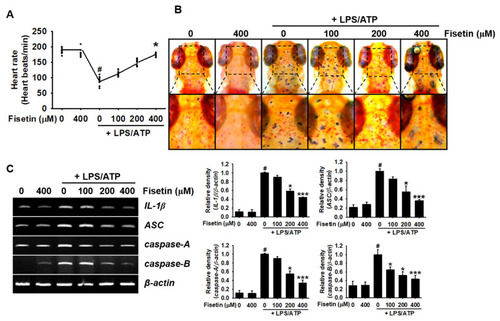
Fisetin inhibits the formation of NLRP3 inflammasome and the expression of IL-1β in zebrafish larvae. After 3 days of fertilization, zebrafish larvae (n = 20) were pretreated with the indicated concentrations of fisetin for 2 h prior to stimulation with 5 µg/mL LPS for 2 h, and subsequent stimulation with 2 mM ATP (LPS/ATP). (A) After 24 h, heart rates were measured for 2 min and expressed as beats/min. (B) Neutral red staining for detecting the distribution of macrophages after 24 h of treatment with LPS/ATP. (C) Total RNA was extracted after 18 h of treatment with LPS/ATP, and the expression of IL-1β, ASC, caspase-A, and caspase-B was determined using RT-PCR. β-Actin was used as a loading control. Relative densities were calculated using ImageJ software. The results indicate the mean ± standard error median (SEM), and is representative of the results obtained from three independent experiments.# p < 0.05 vs. untreated zebrafish larvae; *** p < 0.001 and * p < 0.05 vs. LPS/ATP-treated zebrafish larvae. |

Schematic representation of the inhibitory effect of fisetin on the NLRP3 inflammasome in BV2 microglial cells. Fisetin inhibits the formation of the NLRP3 inflammasome primarily via two signaling pathways. In the first signaling pathway, fisetin competitively antagonizes the recognition of LPS by the TLR4/MD2 complex by binding to SER438 of TLR4 and occluding the hydrophobic pocket of MD2. This inhibits the canonical NF-κB signaling pathway, which consequently suppresses the transcription of IL-1β. In the second pathway, fisetin downregulates the production of mtROS by promoting the elimination of damaged mitochondria in a p62-dependent manner. The inhibition of mtROS production is associated with a decrease in the formation of the NLRP3 inflammasome, which subsequently inhibits the caspase-1-mediated cleavage of pro-IL-1β to active IL-1β. P2RX7, P2X purinoceptor 7. |