
|
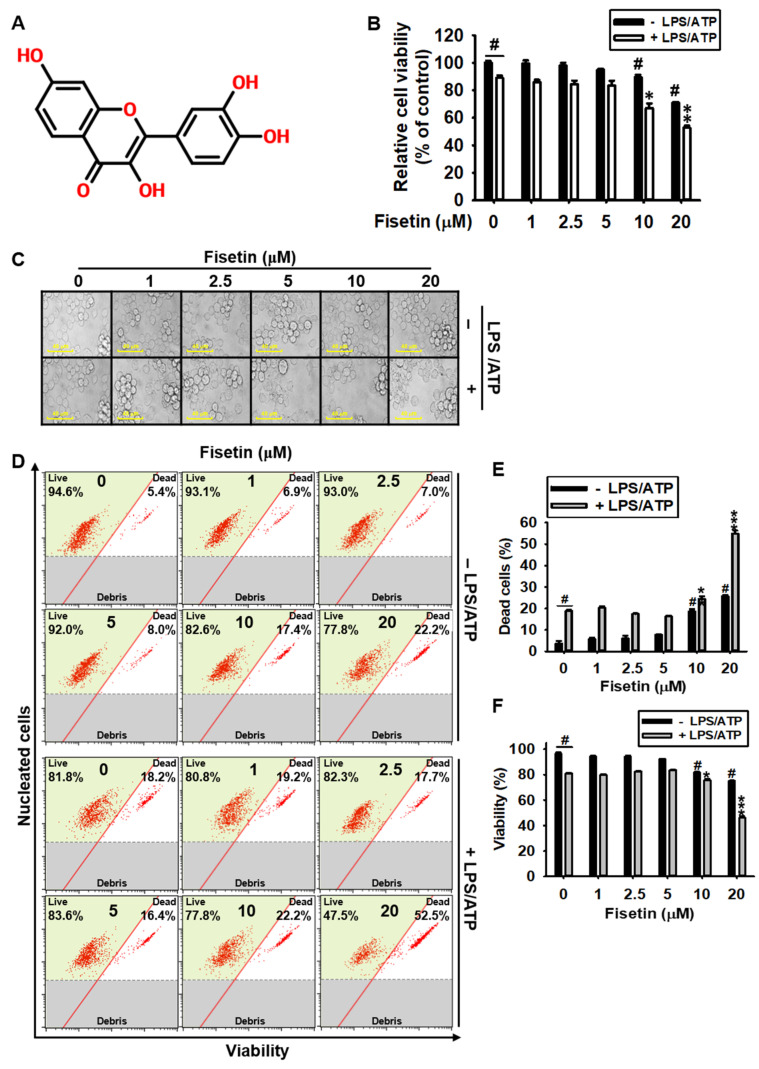
Figure 1
High concentrations of fisetin are cytotoxic to BV2 microglial cells. (A) Chemical structure of fisetin. BV2 microglial cells were treated with the indicated concentrations of fisetin (0–20 µM) for 2 h in the presence or absence of 1 µg/mL LPS for 2 h, followed by treatment with 1 mM ATP (LPS/ATP) for 24 h. (B) Cell viability was analyzed using an MTT assay. (C) Images of the cells were captured using phase-contrast microscopy (×10). (D) The population of dead and viable cells (%) was measured using a Muse Cell Count & Viability Kit. (E,F) Graphical representation of the population of (E) dead and (F) viable cells. The results indicate the mean ± standard error median (SEM), and is representative of the results obtained from three independent experiments. # p < 0.05 vs. untreated cells; *** p < 0.001, ** p < 0.01, and * p < 0.05 vs. LPS/ATP-treated cells.