
- Title
-
Thyroid hormone deficiency during zebrafish development impairs central nervous system myelination
- Authors
- Farías-Serratos, B.M., Lazcano, I., Villalobos, P., Darras, V.M., Orozco, A.
- Source
- Full text @ PLoS One
( |
|
|

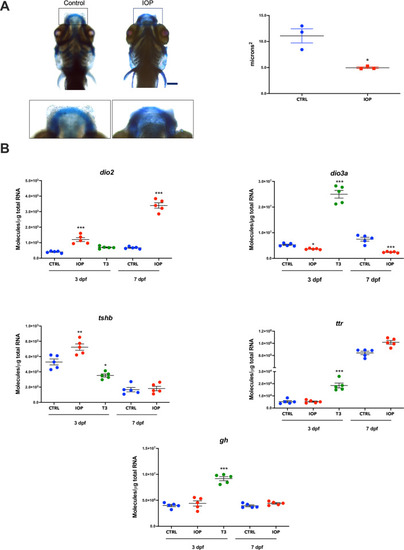
mRNA quantification of |
|
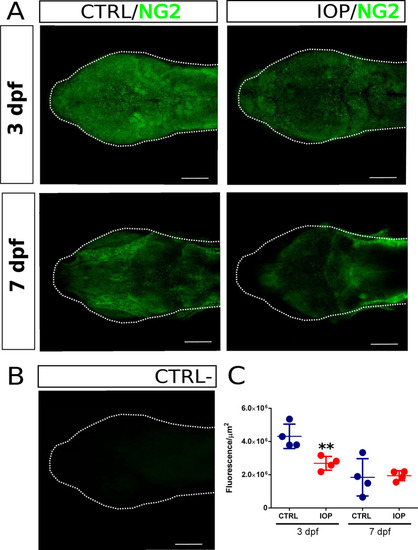
Dorsal view of the head of zebrafish larva at 3 and 7 dpf. ( |