
Fig 3
- ID
- ZDB-IMAGE-210821-10
- Publication
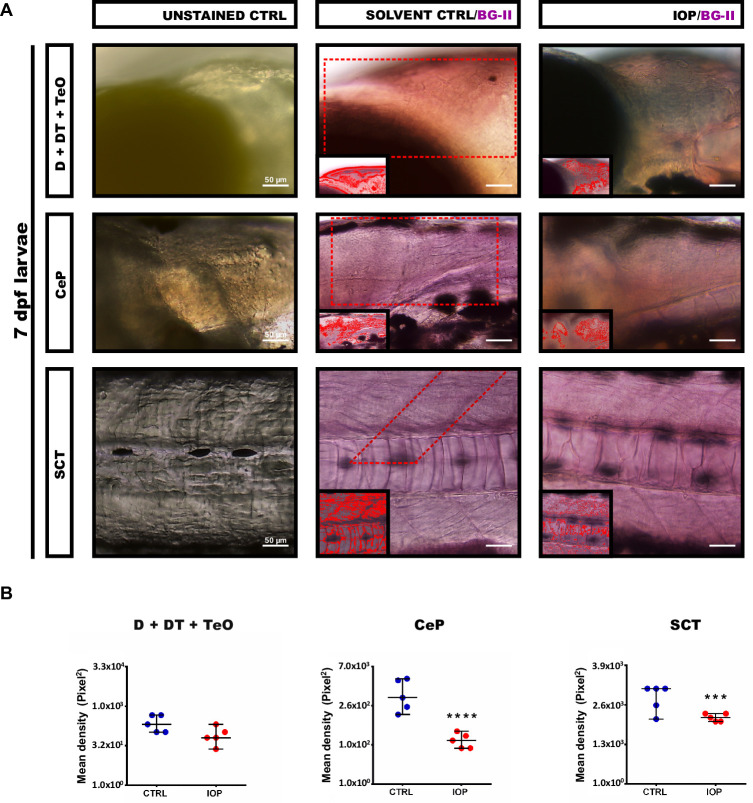
- Farías-Serratos et al., 2021 - Thyroid hormone deficiency during zebrafish development impairs central nervous system myelination
- All Figures
- Figures for Farías-Serratos et al., 2021
|
Fig 3