FIGURE SUMMARY
Title

Gut micobiota alteration by Lactobacillus rhamnosus reduces pro-inflammatory cytokines and glucose level in the adult model of Zebrafish

Authors
Bootorabi, F., Saadat, F., Falak, R., Manouchehri, H., Changizi, R., Mohammadi, H., Safavifar, F., Khorramizadeh, M.R.
Source
Full text @ BMC Res. Notes

This diagram represents the result of blood glucose from all trail groups. Data represents the mean + SE of the results for three independent assays. Statistical analysis compares difference of the mean of results between T2DM-P and HC, HC-P and T2DM. a Significant difference of other groups vs. HC. b Significant difference of other groups vs. HC-P. c Significant difference of other groups vs. T2DM. d Significant difference of other groups vs. T2DM-P Difference with p < 0.001 was considered significant. Each group contained 6 zebrafish

PHENOTYPE:
Fish:
Conditions:
Observed In:
Stage: Adult

A Histopathology evaluation of zebrafish small intestine. Intestinal tissues were stained with H&E and studied by microscopy (× 400 resolution). Healthy control group (HC), Healthy control group supplemented with probiotics (HC-P), Diabetic group (T2DM), Diabetic group supplemented with probiotic (T2DM-P). B Villus length increased slightly in the T2DM-P group following probiotic supplementation compared to T2DM group. C. Villus width was slightly higher in the T2DM group compared to T2DM-P group. Data shows mean ± SE for three independent assays

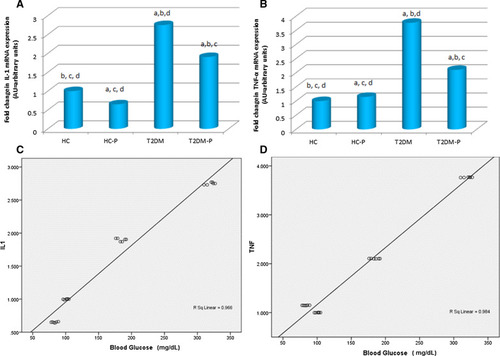
The relative expression of the intestinal pro-inflammatory cytokines after 10 days probiotic intervention. A The effects of probiotic on mRNA expression of IL-1β were determined by PCR. B The relative expression of TNF-α from all trail groups represent. The expression levels of β-actin were used as a loading control. C The Correlation of IL-1β to blood glucose. D The Correlation of TNF-α vs. blood glucose. Control group (HC), Control + Probiotic (HC-P), Diabetic group (T2DM), Diabetic group with probiotic(T2DM-P) groups. a Significant difference of other groups vs. HC. b Significant difference of other groups vs. HC-P. c Significant difference of other groups vs. T2DM. d Significant difference of other groups vs. T2DM-P The mean difference is significant at p < 0.001

EXPRESSION / LABELING:
Genes:
Fish:
Conditions:
Anatomical Term:
Stage: Adult
PHENOTYPE:
Fish:
Conditions:
Observed In:
Stage: Adult
Acknowledgments
This image is the copyrighted work of the attributed author or publisher, and ZFIN has permission only to display this image to its users. Additional permissions should be obtained from the applicable author or publisher of the image. Full text @ BMC Res. Notes