
- Title
-
Molecular and culture-based assessment of the microbiome in a zebrafish (Danio rerio) housing system during set-up and equilibration
- Authors
- Ericsson, A.C., Busi, S.B., Davis, D.J., Nabli, H., Eckhoff, D.C., Dorfmeyer, R.A., Turner, G., Oswalt, P.S., Crim, M.J., Bryda, E.C.
- Source
- Full text @ Anim Microbiome
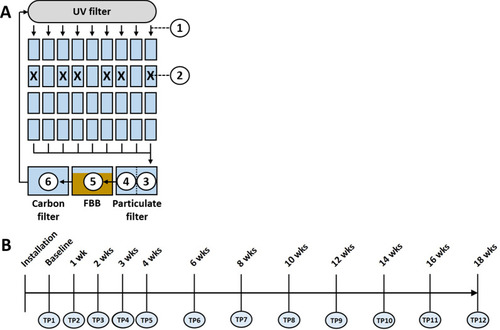
Schematic diagram of the recirculating system, and the sampled sites including post-UV disinfection water (1), tank water from six different tanks in which fish were introduced following collection of baseline samples, denoted by X (2), pre-particulate filter water (3), post-particulate filter water (4), the fluidized bed biofilter (FBB) (5), and carbon filter water (6) ( |
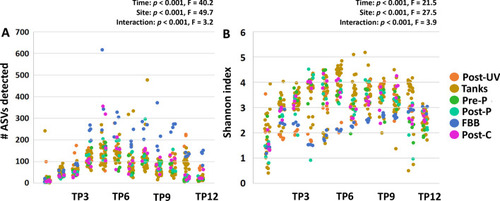
Richness and diversity of the system microbiome plateaus by approximately four weeks post-population. Dot plots showing the detected richness ( |
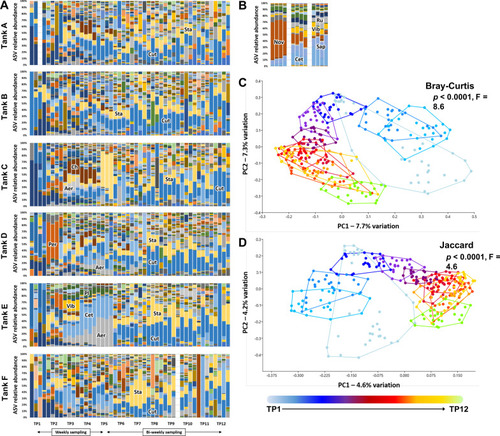
Dominant taxa in tank water are established by two to three weeks post-population. Stacked bar charts showing the progression in microbiome composition in six tanks (A through F), sampled at 12 time-points (4 replicates/time-point) ( |
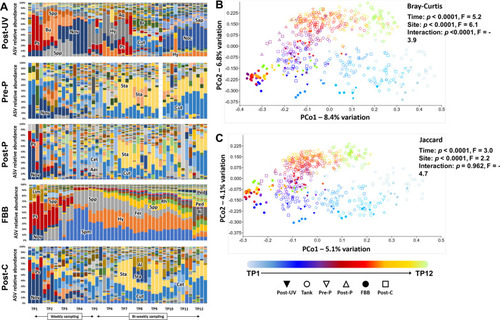
Post-UV disinfection water and FBB harbor dynamic communities, distinct from other sites. Stacked bar charts showing the progression in microbiome composition in the post-UV disinfection water entering the tanks (Post-UV disinfection), the pre- and post-particulate filter water (Pre-P and Post-P, respectively), the fluidized bed biofilter (FBB), and post-carbon filter water (Post-C), sampled at 12 time-points (4 replicates/time-point); ASV = amplicon sequence variant, Aer = Aeromonas, Al = Alloiococcus, Aq = Aquabacterium, Bl = Blastocatellaceae, Br = Bradyrhizobium, Bu = Burkholderiaceae, Cet = Cetobacterium, Ch = Chitinophagales, Cut = Cutibacterium, FBB = fluidized bed biofilter, Fer = Ferruginibacter, Hy = Hydrogenophaga, Lim = Limnobacter, Noc = Nocardia, Nov = Novosphingobium, Ped = Pedosphaeraceae, Per = Perlucidibaca, Pl = Plesiomonas, Ps = Pseudomonas, Rh = Rhodobacteraceae, Sap = Saprospiraceae, Spp = Sphingopyxis, Spm = Sphingomonadaceae, Sta = Staphylococcus, Vib = Vibrio (A) and principal coordinate analysis plots of those samples and tank water, based on Bray–Curtis (B) and Jaccard (C) similarities. ASV = amplicon sequence variant, TP = time-point, color-bar and symbol legends at bottom; taxonomic abbreviations listed at beginning of manuscript. p and F values associated with main effects of time and sample site based on two-way permutation multivariate analysis of variance (PERMANOVA) |
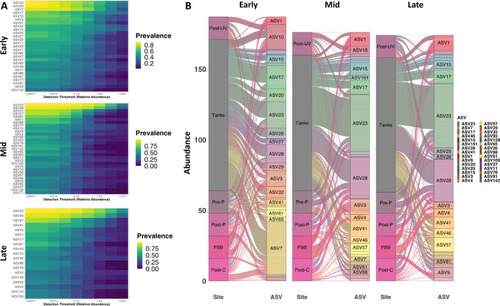
Limited number of taxa comprise core community throughout equilibration. Heatmaps showing prevalence (legend at right) of core ASVs at increasing thresholds of relative abundance at Early (TP1 to TP4), Mid (TP5 to TP8), and Late (TP9 to TP12) time-points ( |
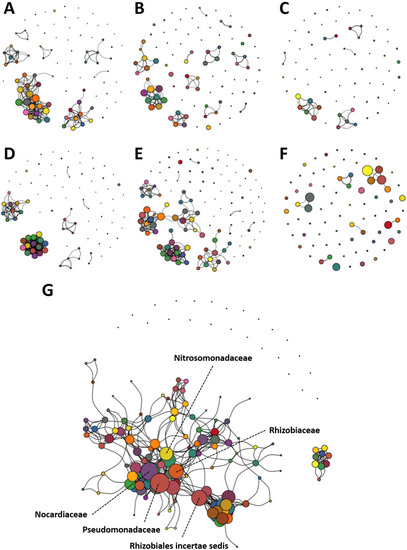
Enriched networks present in FBB and post-UV disinfection water dominated by several |
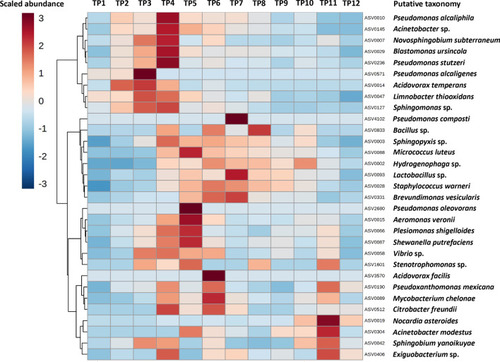
Cultivable taxa expand early during equilibration. Heatmap showing cube root-transformed mean relative abundance (legend upper left) at each time point (TP), of amplicon sequence variants (ASVs) matching the taxonomies assigned to culture isolates via MALDI-TOF |