
Image
|
Figure Caption
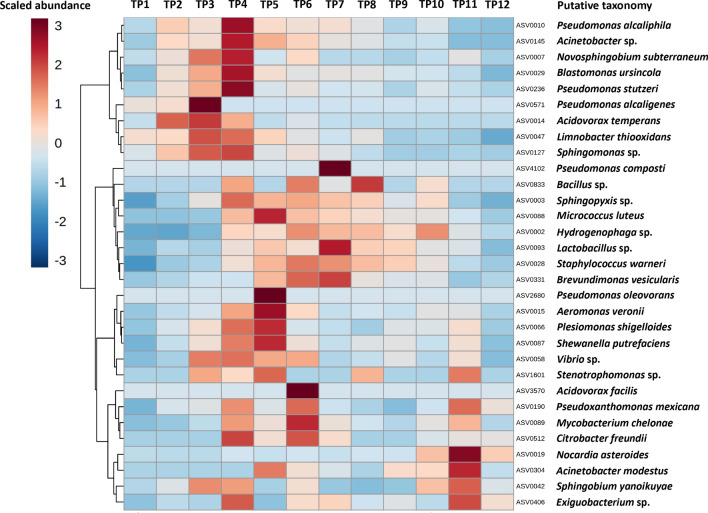
Fig. 7
Cultivable taxa expand early during equilibration. Heatmap showing cube root-transformed mean relative abundance (legend upper left) at each time point (TP), of amplicon sequence variants (ASVs) matching the taxonomies assigned to culture isolates via MALDI-TOF
Acknowledgments
This image is the copyrighted work of the attributed author or publisher, and
ZFIN has permission only to display this image to its users.
Additional permissions should be obtained from the applicable author or publisher of the image.
Full text @ Anim Microbiome