FIGURE

Fig. 3

ID
ZDB-FIG-210809-3
Publication
Ericsson et al., 2021 - Molecular and culture-based assessment of the microbiome in a zebrafish (Danio rerio) housing system during set-up and equilibration
Other Figures
All Figure Page
Back to All Figure Page
Fig. 3

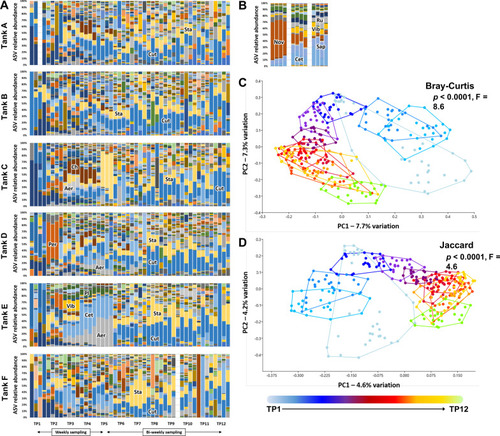
Dominant taxa in tank water are established by two to three weeks post-population. Stacked bar charts showing the progression in microbiome composition in six tanks (A through F), sampled at 12 time-points (4 replicates/time-point) (A) and the pre-existing tanks from which fish originated; ASV = amplicon sequence variant, Aer = Aeromonas, Cet = Cetobacterium, Ch = Chitinophagales, Cut = Cutibacterium, Nov = Novosphigobium, Per = Perlucidibaca, Pl = Plesiomonas, Ru = Runella, Sap = Saprospiraceae, Sta = Staphylococcus, Vib = Vibrio (B). Principal coordinate analysis plots based on Bray–Curtis (C) and Jaccard (D) similarities. TP = time-point, color-bar legend at bottom; taxonomic abbreviations listed at beginning of manuscript. p and F values associated with main effect of time based on one-way permutation multivariate analysis of variance (PERMANOVA)

Expression Data

Expression Detail
Antibody Labeling
Phenotype Data

Phenotype Detail
Acknowledgments
This image is the copyrighted work of the attributed author or publisher, and ZFIN has permission only to display this image to its users. Additional permissions should be obtained from the applicable author or publisher of the image. Full text @ Anim Microbiome