FIGURE SUMMARY
Title

A connexin/ifi30 pathway bridges HSCs with their niche to dampen oxidative stress

Authors
Cacialli, P., Mahony, C.B., Petzold, T., Bordignon, P., Rougemont, A.L., Bertrand, J.Y.
Source
Full text @ Nat. Commun.

Oxidative stress induces a defect in HSPC proliferation in the CHT niche at 48 hpf.

a Confocal imaging in the CHT of 48 hpf kdrl:mCherry/cmyb:GFP embryos. Embryos non-treated (NT) or incubated with H2O2 (3 mM). b Quantification of HSPCs associated with ECs. Statistical analysis: unpaired two-tailed t test, ***P < 0.001. Center values denote the mean, and error values denote s.e.m. c Anti-GFP and pH3 immunostaining of NT or H2O2-treated (3 mM) cmyb:GFP embryos. d Quantification of proliferating HSPCs; statistical analysis: unpaired two-tailed t test, ***P < 0.001. Center values denote the mean, and error values denote s.e.m. ecmyb expression at 48 hpf in NT embryos, and embryos treated with H2O2 (3 mM) or GSH (10 µm). f Quantification of cmyb-expressing cells in the CHT at 48 hpf. Statistical analysis was performed using a one-way ANOVA with Tukey–Kramer post hoc tests, adjusted for multiple comparison, ****P < 0.0001; (n.s.) non-significant P = 0.15. Center values denote the mean, and error values denote s.e.m. Scale bars: 50 μm (a); 25 μm (c); 100 μm (e).

<italic>ifi30</italic> is expressed in CHT endothelial cells.

a WISH against ifi30 at 24, 33, and 48 hpf. b Double WISH at 48 hpf against ifi30 (purple) and cdh5 (red), black arrows indicate the expression of cdh5 in dorsal aorta (DA) and the overlapping expression with ifi30 in the posterior cardinal vein (PCV). c qPCR data examining ifi30 expression (fold change relative to expression in kdrl:GFP+ head subset) in FACS-sorted cells from kdrl:GFP, ikaros:GFP, and mpeg1:GFP embryos. GFP+ cells from dissected heads and tails were sorted from 48 hpf embryos (for each transgenic line have been pooled n = 20 embryos), and each experiment was repeated independently three times. Statistical analysis was performed using a one-way ANOVA with Tukey–Kramer post hoc tests, adjusted for multiple comparisons, *P = 0.013; **P = 0.001; ****P < 0.0001. Center values denote the mean, and error values denote s.e.m. d Imaged area in the tail at 48 hpf, as indicated by the black dotted line. Confocal imaging in the CHT of kdrl:mCherry/cmyb:GFP embryos in non-injected and ifi30-full mRNA injected embryos. The white arrows indicate kdrl and cmyb double-positive cells. e Quantification of HSPCs associated to ECs. Statistical analysis: unpaired two-tailed t test ****P < 0.0001. Center values denote the mean, and error values denote s.e.m. Scale bars: 200 μm (a, b); 50 μm (d).

<italic>Ifi30</italic> overexpression increases the number of HSPCs in the CHT and rescues the loss of HSPCs after ROS challenge.

a Experimental outline to generate double-transgenic kdrl:Gal4;UAS:ifi30. b WISH for ifi30 at 24 hpf in kdrl:Gal4+ embryos that were either UAS:ifi30 negative (upper) or positive (lower). c WISH for cmyb at 4 dpf in kdrl:Gal4+ embryos that were either UAS:ifi30 negative (upper) or positive (lower). d WISH against cmyb at 48 hpf in kdrl:Gal4+ embryos that were either UAS:ifi30- (upper) or UAS:ifi30+ (lower), NT and H2O2-treated. e Quantification of cmyb-expressing cells. Statistical analysis: one-way ANOVA with Tukey–Kramer post hoc tests, adjusted for multiple comparisons, **P = 0.013; ****P < 0.0001. Center values of all statistical analyses denote the mean, and error values denote s.e.m. Scale bars: 200 μm (b, c), 100 μm (d).

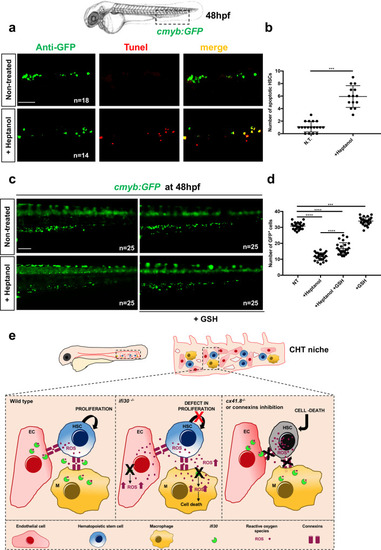
<italic>ifi30</italic>-deficiency increases ROS levels in ECs and induces a defect in HSPC proliferation.

acmyb expression at 48 hpf in wild type and ifi30−/− embryos, after the injection of control or ifi30-morpholino. b Quantification of cmyb-expressing cells. Statistical analysis: one-way ANOVA, with Tukey–Kramer post hoc tests, adjusted for multiple comparisons, ****P < 0.0001, (n.s.) non-significant P = 0.84; P = 0.32. Center values of all statistical analysis denote the mean, and error values denote s.e.m. c Confocal imaging in the CHT of kdrl:GFP+ cells (green), CellROX fluorescent probe (red) and merge (yellow). d Representative FACS plots showing dissociated zebrafish embryos after injection of control or (e) ifi30-morpholinos. FACS plots are gated on live cells. f Histogram plot showing the overlap of both samples, gated on kdrl+ cells. g Quantification of the percentage of kdrl:GFP+ cells affected by oxidative stress (ROS+) in ifi30-morphants (ifi30-MO) and controls (ctrl-MO) at 48 hpf. Data points are the mean of n = 4 biological replicates ± SD. Statistical analysis: unpaired two-tailed t test, **P = 0.007. Center values of all statistical analysis denote the mean, and error values denote s.e.m. h Fluorescence imaging in the CHT of kdrl:mCherry;cmyb:GFP embryos injected with control- and ifi30-MOs and treated with GSH. i Quantification of HSPCs associated with ECs. Statistical analysis: one-way ANOVA, with Tukey–Kramer post hoc tests, adjusted for multiple comparisons, *P = 0.028; **P = 0.008; ****P < 0.0001. The center values of all statistical analyses denote the mean, and error values denote s.e.m. Scale bars: 200 μm (a), 100 μm (c, d).

<italic>Cx41.8</italic><sup><italic>−/−</italic></sup> mutant embryos show a decrease in HSPCs which is rescued by antioxidant treatment.

a qPCR data examining cx41.8 expression (fold change relative to expression in kdrl:GFP+ head subset) in FACS-sorted cells from kdrl:GFP, ikaros:GFP and mpeg1:GFP embryos. GFP+ cells from dissected heads and tails were sorted from 48 hpf embryos. b For each transgenic line have been pooled n = 20 animals, and each experiment was repeated independently three times. Statistical analysis was completed using a one-way ANOVA, with Tukey–Kramer post hoc tests, adjusted for multiple comparisons *P = 0.018; **P = 0.001; (n.s.) non-significant P = 0.26; P = 0.74. ccmyb expression at 60 hpf in wild type and cx41.8−/− embryos, and after GSH treatment. d Quantification of cmyb-expressing cells. Statistical analysis: one-way ANOVA, with Tukey–Kramer post hoc tests, adjusted for multiple comparisons, *P = 0.045; ****P < .0001. Center values denote the mean, and error values denote s.e.m. e Imaged area in the tail at 48 hpf, as indicated by the black dotted line. Confocal imaging of the CHT at 48 hpf of cmyb:GFP+ cells (green), CellROX fluorescent probe (red) and merge, in NT and after heptanol treatment cmyb:GFP embryos. Orthogonal projection CellROX+cmyb:GFP+ double-positive cell after heptanol treatment. Scale bars: 100 μm (c); 25 μm (e).

Loss of HSPCs after connexin inhibition with drug treatment can be rescued by GSH treatment.

a Anti-GFP and TUNEL staining of NT and heptanol-treated cmyb:GFP embryos. b Quantification of the number of apoptotic HSPCs in both conditions. Statistical analysis was performed using an unpaired two-tailed t test ***P < .001. Center values denote the mean and error values denote s.e.m. c Fluorescence imaging of NT and heptanol-treated (50 μM) cmyb:GFP embryos and after GSH treatment. d Quantification of cmyb:GFP+ cells. Statistical analysis: one-way ANOVA with Tukey–Kramer post hoc tests, adjusted for multiple comparisons, ***P = 0007; ****P < .0001. Center values denote the mean and error values denote s.e.m. e HSPCs directly communicate with ECs and macrophages (MΦ) in the embryonic niche through connexin channels. Under normal conditions ifi30 reduces oxidized glutathione GSSG into reduced GSH, maintaining low levels of ROS in the CHT/HSPCs. The deficiency of ifi30 increases GSSG levels and increases ROS in the CHT niche, generating a defect of HSPC proliferation. The connexin-deficient embryos (cx41.8 mutants or treated with connexin inhibitors) present ROS accumulation directly in HSPCs, inducing their cell death. Scale bars: 100 μm (ac).

HSPCs interact with <italic>IFI30</italic>+ cells in human fetal liver.

a Double immunostaining against GILT/IFI30 and CD117 on sections of human fetal liver at different stages of gestation. b Distribution of GILT/IFI30+ cells (red line), CD117+ cells (brown line), and IFI30+ cells in contact with CD117+ cells (green line). For each developmental stage, only one human fetal liver sample was used (N = 1), but three different sections were analyzed. c High magnification of double immunostaining against GILT/IFI30 (red) CD117 (brown) and nuclei (blue), on sections of human fetal liver at 13 weeks of gestation. Scale bars: 10 μm. d Double immunostaining against GILT/IFI30 (black), CD68 (cyan), and nuclei (blue) in sections of human fetal liver at 13 weeks of gestation. All red arrows point to double-stained cells. Scale bars: 100 μm (a); 25 μm (c); 200 μm. Right panel shows a magnification of the region delimited by the red dotted line (d).

Acknowledgments
This image is the copyrighted work of the attributed author or publisher, and ZFIN has permission only to display this image to its users. Additional permissions should be obtained from the applicable author or publisher of the image. Full text @ Nat. Commun.