
- Title
-
Injury-induced autophagy delays axonal regeneration after optic nerve damage in adult zebrafish
- Authors
- Beckers, A., Vanhunsel, S., Van Dyck, A., Bergmans, S., Masin, L., Moons, L.
- Source
- Full text @ Neuroscience
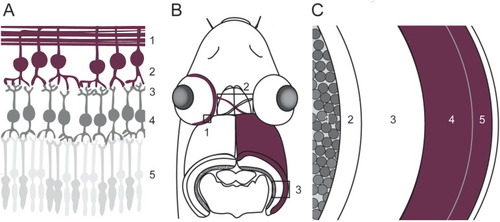
Fig. 1. Schematic representation of the studied components of the zebrafish visual system. (A) The first part of the visual system is the retina, in which the visual information flows from the photoreceptors (5) to the inner neurons (4) and eventually to the RGCs (2). The dendrites of the RGCs are located within the IPL (2), while the axons, in contrast, bundle inside the NFL (1) and form the optic projection. (B) From the retina (1), the optic projection, containing the optic nerve, optic chiasm and optic tract (all 2), innervates the optic tectum (3). (C) The two main domains of the zebrafish optic tectum are the PGZ (1) in which most of the cell bodies of the optic tectum are located, and the synaptic neuropil area (2–5, being the SEC, SGC, SFGS and SO, respectively). RGC axons mainly innervate the SO and SFGS (4–5). INL, inner nuclear layer; IPL, inner plexiform layer; NFL, nerve fiber layer; PGZ, periventricular gray zone; PRL, photoreceptor layer; RGC, retinal ganglion cell; RGCL, retinal ganglion cell layer; SAC, stratum album centrale; SFGS, stratum fibrosum et griseum superficiale; stratum opticum; SGC, stratum griseum centrale; SO, stratum opticum. |
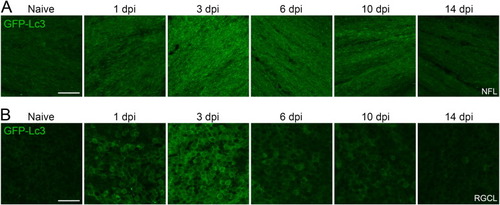
Fig. 2. Visualization of the autophagic response in the NFL and RGCL at different time points after ONC using retinal whole mounts of Tg(CMV:GFP-Lc3) autophagy reporter fish. (A) In the NFL of the fish retina, GFP-Lc3 fluorescence intensity was significantly increased from 1 dpi and reached its maximum value at 3 dpi. Hereafter, the Lc3 reporter signal decreased and baseline levels were reached two weeks after injury. (B) A similar trend was observed for the Lc3 signal in the RGCL. Scale bar = 25 µm. Representative images of n = 4. Dpi, days post-injury; GFP, green fluorescent protein; Lc3, microtubule-associated protein 1A/1B-light chain 3; NFL, nerve fiber layer; RGCL, retinal ganglion cell layer. |
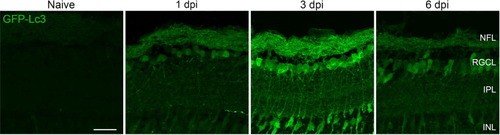
Fig. 3. Autophagy visualization at early time points after optic nerve injury using retinal cryosections of Tg(CMV:GFP-Lc3) autophagy reporter fish. The intensity of the GFP-Lc3 signal increased in the NFL and RGCL early after ONC, and peaked at 3 dpi. In addition, autophagy was observed in the IPL, in the form of GFP-Lc3+ fibers, and as a general overall increase of GFP fluorescence throughout this layer, both most pronounced at 3 dpi. In addition, GFP-Lc3+ somas inside the INL were also visible at this time point. Scale bar = 25 µm. Representative images of n = 4. Dpi, days post-injury; GFP, green fluorescent protein; INL, inner nuclear layer; IPL, inner plexiform layer; Lc3, microtubule-associated protein 1A/1B-light chain 3; NFL, nerve fiber layer; RGCL, retinal ganglion cell layer. |
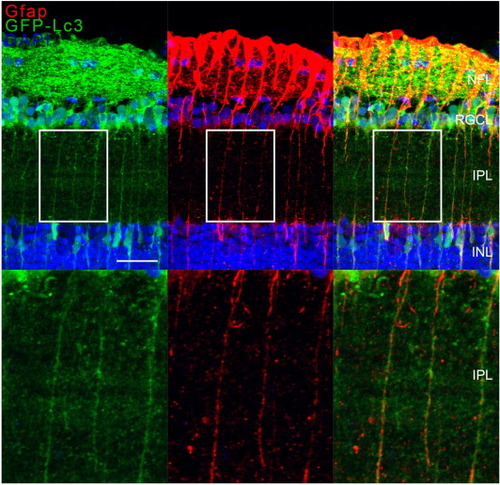
Fig. 4. Immunostaining for Gfap on retinal cryosections of Tg(CMV:GFP-Lc3) autophagy reporter fish, three days after ONC. Representative images disclosed a clear co-localization of the Lc3 (green) and Gfap (red) signal in the IPL, as well as in the NFL, where the end feet of the Müller glia are positioned. Scale bar = 25 µm. Representative image of n = 4. Dpi, days post-injury; GFP, green fluorescent protein; INL, inner nuclear layer; IPL, inner plexiform layer; Gfap, glial fibrillary acidic protein; Lc3, microtubule-associated protein 1A/1B-light chain 3; NFL, nerve fiber layer; RGCL, retinal ganglion cell layer. (For interpretation of the references to colour in this figure legend, the reader is referred to the web version of this article.) |

Fig. 5. Autophagy visualization in the RGC axons using horizontal visual system sections of Tg(CMV:GFP-Lc3) reporter fish, at different time points after optic nerve injury. (A) Overview of the zebrafish visual system, showing the left and right retinas, optic nerves, optic chiasm (indicated with a star) and the optic tecta. The white rectangle indicates where the pictures of panel B are taken (left optic nerve). (B) The GFP-Lc3 signal intensity was only marginally increased one day after optic nerve damage inside RGC axons, but was massively enhanced two days later, mainly before and near the crush site. The white arrow in the 3 dpi panel indicates a cell expressing Lc3. At 6 dpi, the more faint GFP-Lc3 fluorescence was evenly spread throughout the RGC axons, while it was predominantly located close to the brain at 10 dpi. The autophagy response inside the axons almost completely resolved two weeks after ONC. Scale bar = 200 µm. Representative image of n = 4. The white line indicates the crush site. Dpi, days post-injury; GFP, green fluorescent protein; Lc3, microtubule-associated protein 1A/1B-light chain 3; NFL, nerve fiber layer; ON, optic nerve/chiasm/tract; ONC, optic nerve crush; RGCL, retinal ganglion cell layer. |
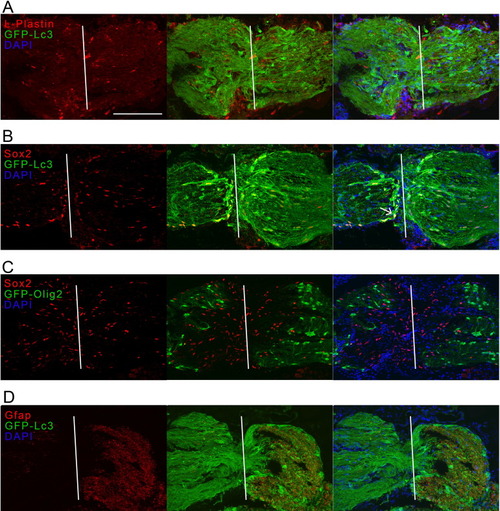
Fig. 6. Immunostaining for L-plastin, Sox2 and Gfap on optic nerve cryosections of Tg(CMV:GFP-Lc3) autophagy reporter fish and for Sox2 on optic nerve sections of Tg(olig2-GFP) fish, all tissues harvested at three days after optic nerve injury. (A) No overlap between the pan-leukocyte marker L-plastin (red) and Lc3 (green) could be detected in the injured optic nerve. (B) Lc3+ cells (green) overlapped with the Sox2 pluripotency marker (red), which could be expressed by glial precursor cells including OPCs, activated astroglia or newly differentiated oligodendrocytes during remyelination. See one double-positive cell indicated with an arrow. (C) OPCs and oligodendrocytes, positive for olig2 (green), did not show co-labeling with Sox2 (red). (D) Gfap (red), used to label astroglia and radial glia, and here possibly glial precursor cells, was strongly upregulated behind the site of impact at 3 dpi and overlapped partially with the autophagy reporter (green). Scale bar = 200 µm. Representative images of n = 4. The white line indicates the crush site. Dpi, days post-injury; Gfap, glial fibrillary acid protein; GFP, green fluorescent protein; Lc3, microtubule-associated protein 1A/1B-light chain 3; ONC, optic nerve crush; Sox2, sex determining region Y-box2. (For interpretation of the references to colour in this figure legend, the reader is referred to the web version of this article.) |
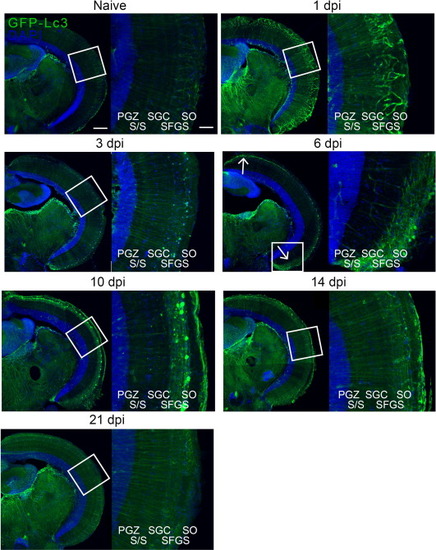
Fig. 7. Characterization of autophagy induction in the optic tectum using vibratome sections of Tg(CMV:GFP-Lc3) fish, at different time points after optic nerve damage. In contrast to the naive condition showing low levels of GFP-Lc3 fluorescence, a bright striped pattern was visible in the SO and SFGS of the optic tectum one day after ONC. Thereafter, GFP-Lc3+ somas were visible at 3, 6 and 10 dpi, with the latter two time points also showing more fluorescent labeling in areas where RGC axon terminals reinnervate the superficial layers of the optic tectum (SFGS and SO) after ONC. The autophagic response is diminished at 14 dpi, but only resolves in three weeks after injury. Scale bar = 200 µm (left panels) or 25 µm (right panels). White arrows at 6 dpi indicate the dorsomedial and ventrolateral peripheral areas of the optic tectum, where the RGC axons re-enter first. Representative images of n = 4. Dpi, days post-injury; GFP, green fluorescent protein; post-injury; Lc3, microtubule-associated protein 1A/1B-light chain 3; PGZ, periventricular gray zone; SAC, stratum album centrale; SFGS, stratum fibrosum et griseum superficiale; SGC, stratum griseum centrale; SO, stratum opticum. |
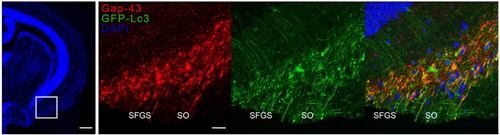
Fig. 8. Immunostaining for Gap-43 on brain sections of GFP-Lc3 zebrafish at 6 dpi. Representative images reveal that in the optic tectum, the Gap-43+ (red) and Lc3+ (green) fluorescent signals largely co-localize (yellow-orange), as observed in the merged picture. Scale bars = 200 µm (DAPI overview) and 30 µm (zoom). Representative image of n = 4 Dpi, days post-injury; GFP; green fluorescent protein; Gap-43, growth-associated protein 43; Lc3, microtubule-associated protein 1A/1B-light chain 3; SFGS, stratum fibrosum et griseum superficiale; SO, stratum opticum. (For interpretation of the references to colour in this figure legend, the reader is referred to the web version of this article.) |
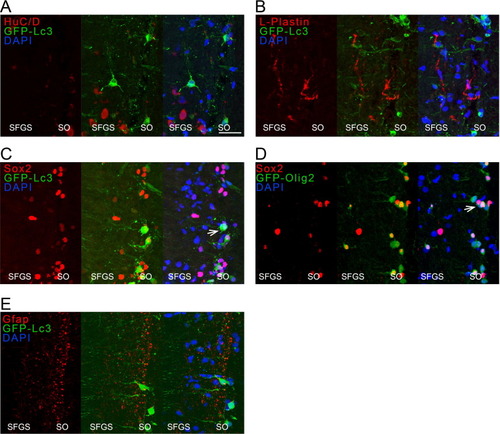
Fig. 9. Immunostaining for HuC/D, L-plastin, Gfap and Sox2 on optic tectum cryosections of Tg(CMV:GFP-Lc3) autophagy reporter fish and for Sox2 on sections of Tg(olig2-GFP), all tissues harvested at three days after optic nerve injury. (A, B) No overlap between the pan-neuronal HuC/D or pan-leukocyte marker L-plastin (both in red) could be detected with the Lc3+ cells (green). (C) The cells with elevated autophagy levels (green) did co-label with the Sox2 pluripotency marker (red, one marked with an arrow). (D) The Sox2+ cells (red) were often also positive for olig2 (green, one indicated with an arrow), visualizing oligodendrocyte precursor cells or oligodendrocytes. (E) Finally, Gfap (red) was mainly present there where the Lc3+ cells (green) were located, but no overlap is visible. Scale bar = 25 µm. Representative images of n = 4. Dpi, days post-injury; Gfap, glial fibrillary acid protein; GFP, green fluorescent protein; Hu, Hu proteins; Lc3, microtubule-associated protein 1A/1B-light chain 3; ONC, optic nerve crush; SFGS, stratum fibrosum et griseum superficiale; SO, stratum opticum; Sox2, sex determining region Y-box2. (For interpretation of the references to colour in this figure legend, the reader is referred to the web version of this article.) |
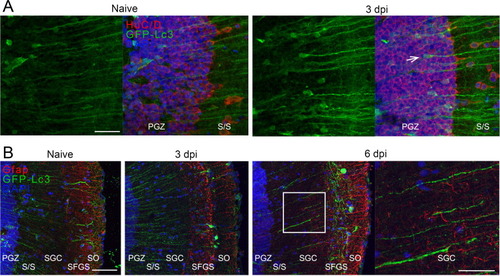
Fig. 10. Immunostaining for HuC/D and Gfap on optic tectum cryosections of Tg(CMV:GFP-Lc3) autophagy reporter fish, in naive and injured conditions. (A) At three days after ONC injury, more cells in the nuclear PGZ zone of the optic tectum contained high levels of the autophagy marker (green) and these cells were identified as neurons using an HuC/D staining (red, panel A, one indicated with an arrow). (B) The Lc3 fluorescent signal (green) intensified after injury in the fibers running through the optic tectum (see also in 10A), which are likely dendrites from PGZ neurons as they did not co-label with Gfap (red). Scale bar panel A = 25 µm, scale bar panel B = 200 µm and 100 µm (zoom). Representative images of n = 4. Dpi, days post-injury; Gfap, glial fibrillary acid protein; GFP, green fluorescent protein; Hu, Hu proteins; Lc3, microtubule-associated protein 1A/1B-light chain 3; ONC, optic nerve crush; PGZ, periventricular gray zone; SAC, stratum album centrale; SFGS, stratum fibrosum et griseum superficiale; stratum opticum; SGC, stratum griseum centrale; SO, stratum opticum. (For interpretation of the references to colour in this figure legend, the reader is referred to the web version of this article.) |

Fig. 11. Quantification of tectal reinnervation via anterograde biocytin tracing six days post optic nerve damage in untreated, vehicle-treated or bafilomycin A1-treated fish. (A) Representative images and semi-quantitative analysis (B) of the tectal area covered by RGC axon terminals show that bafilomycin A1 has a positive effect on axonal regeneration as more axons re-entered the optic tectum after autophagy inhibition, compared to untreated or vehicle-treated control fish. Scale bar = 200 µm. N = 6–7, except naive (3). Baf, bafilomycin A1; dpi, days post-injury. |
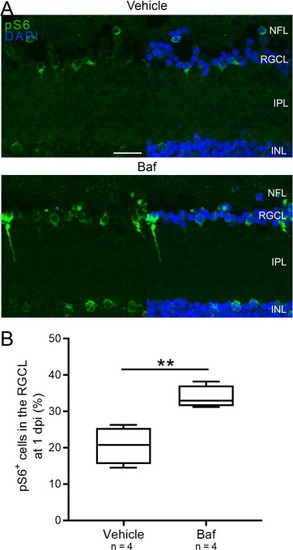
Fig. 12. Visualization and quantification of the pS6+ cells one day after optic nerve damage and vehicle or bafilomycin A1 treatment. (A) Representative retinal images show more pS6+ cells one day after injury in the RGCL after bafilomycin treatment. (B) Quantification of the number of pS6+ cells confirms this finding. Scale bar = 20 µm. Representative images of n = 4. N = 4. Baf, bafilomycin A1; dpi, days post-injury; INL, inner nuclear layer; IPL, inner plexiform layer; NFL, nerve fiber layer; RGCL, retinal ganglion cell layer; pS6, phosphorylated S6. |