
|
Fig. 5
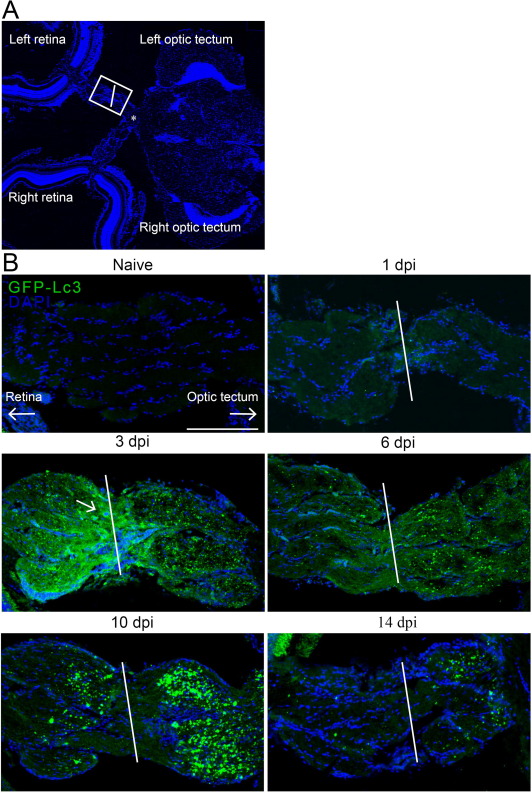
Fig. 5. Autophagy visualization in the RGC axons using horizontal visual system sections of Tg(CMV:GFP-Lc3) reporter fish, at different time points after optic nerve injury. (A) Overview of the zebrafish visual system, showing the left and right retinas, optic nerves, optic chiasm (indicated with a star) and the optic tecta. The white rectangle indicates where the pictures of panel B are taken (left optic nerve). (B) The GFP-Lc3 signal intensity was only marginally increased one day after optic nerve damage inside RGC axons, but was massively enhanced two days later, mainly before and near the crush site. The white arrow in the 3 dpi panel indicates a cell expressing Lc3. At 6 dpi, the more faint GFP-Lc3 fluorescence was evenly spread throughout the RGC axons, while it was predominantly located close to the brain at 10 dpi. The autophagy response inside the axons almost completely resolved two weeks after ONC. Scale bar = 200 µm. Representative image of n = 4. The white line indicates the crush site. Dpi, days post-injury; GFP, green fluorescent protein; Lc3, microtubule-associated protein 1A/1B-light chain 3; NFL, nerve fiber layer; ON, optic nerve/chiasm/tract; ONC, optic nerve crush; RGCL, retinal ganglion cell layer.