
Fig. 10
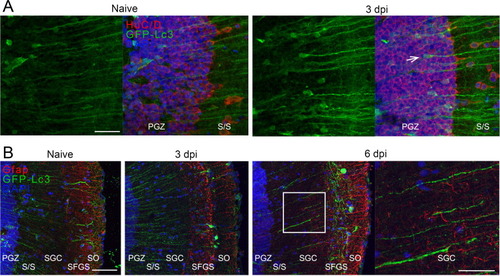
Fig. 10. Immunostaining for HuC/D and Gfap on optic tectum cryosections of Tg(CMV:GFP-Lc3) autophagy reporter fish, in naive and injured conditions. (A) At three days after ONC injury, more cells in the nuclear PGZ zone of the optic tectum contained high levels of the autophagy marker (green) and these cells were identified as neurons using an HuC/D staining (red, panel A, one indicated with an arrow). (B) The Lc3 fluorescent signal (green) intensified after injury in the fibers running through the optic tectum (see also in 10A), which are likely dendrites from PGZ neurons as they did not co-label with Gfap (red). Scale bar panel A = 25 µm, scale bar panel B = 200 µm and 100 µm (zoom). Representative images of n = 4. Dpi, days post-injury; Gfap, glial fibrillary acid protein; GFP, green fluorescent protein; Hu, Hu proteins; Lc3, microtubule-associated protein 1A/1B-light chain 3; ONC, optic nerve crush; PGZ, periventricular gray zone; SAC, stratum album centrale; SFGS, stratum fibrosum et griseum superficiale; stratum opticum; SGC, stratum griseum centrale; SO, stratum opticum. (For interpretation of the references to colour in this figure legend, the reader is referred to the web version of this article.) |