
- Title
-
BMP and Notch Signaling Pathways differentially regulate Cardiomyocyte Proliferation during Ventricle Regeneration
- Authors
- Wang, W., Hu, Y.F., Pang, M., Chang, N., Yu, C., Li, Q., Xiong, J.W., Peng, Y., Zhang, R.
- Source
- Full text @ Int. J. Biol. Sci.

Activation of BMP signaling pathway during ventricle regeneration. (A-D') Whole-mount in situ hybridizations showed upregulated expression of BMP signaling components in ablated hearts (A'-D') compared to control hearts (A-D) at 5 dpf/2 dpt. (E-G) Confocal stack projections of Tg(vmhc:mCherry-NTR; Bre:dGFP) hearts showed BMP signaling activation at 1-2 dpt. (H-J) Confocal stack projections of immunofluorescence showed BMP signaling activation at 1-2 dpt. Green, phospho-Smad1/5/9; red, myosin heavy chain (MF20). (K-N') Overlay of Bre:dGFP and pSmad1/5/9 signals in myocardium and epicardium at 2 dpt. (K-N) stack projections, (K'-N') optical sections. Scale bars, (A-D') 25 µm, (E-N') 50 µm. dpf, days post fertilization; dpt, days post MTZ-treatment; A, atrium; V, ventricle. Dashed lines outline the hearts. |
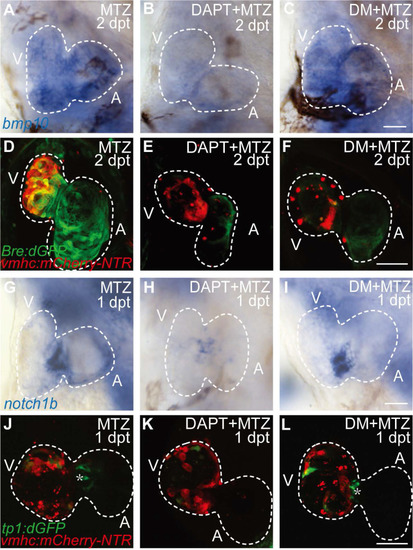
BMP signaling acts downstream of Notch signaling during ventricle regeneration. (A-C) Whole-mount in situ hybridizations showed upregulated bmp10 expression in ablated hearts at 2 dpt could be blocked by Notch signaling inhibitor DAPT but not BMP signaling inhibitor DM. (D-F) Confocal stack projections of Tg(vmhc:mCherry-NTR; Bre:dGFP) hearts showed BMP signaling activation at 2 dpt could be blocked by both DAPT and DM. (G-I) Whole-mount in situ hybridizations showed upregulated notch1b expression in ablated hearts at 1 dpt could be blocked by DAPT but not DM. (J-L) Confocal stack projections of Tg(vmhc:mCherry-NTR; tp1:dGFP) hearts showed Notch signaling activation at 1 dpt could be attenuated by DAPT but not DM. Asterisk, Notch signal at the atrioventricular canal. Scale bars, (A-C, G-I) 25 µm, (D-F, J-L) 50 µm. dpt, days post MTZ-treatment; A, atrium; V, ventricle; DM, dorsomorphin. Dashed lines outline the hearts. |
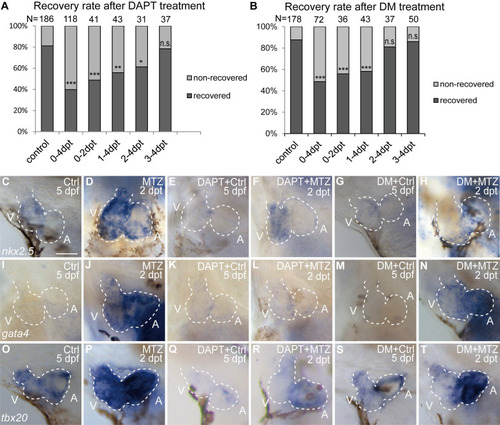
BMP and Notch signaling pathways differentially influence ventricle regeneration and cardiogenic factor re-activation. (A, B) Quantification of heart recovery rate in control and DAPT-treated or DM-treated ablated hearts at 4 dpt. The numbers of larvae analyzed were indicated. Binomial test, n.s, non-significant, *, P < 0.05, **, P <0.01, ***, P < 0.001. (C-T) Whole-mount in situ hybridizations showed different effects on the re-activation of cardiogenic factor nkx2.5 (C-H), gata4 (I-N), tbx20 (O-T) after DAPT or DM treatment at 5 dpf/2 dpt. Scale bar, 50 µm. dpf, days post fertilization; dpt, days post MTZ-treatment; A, atrium; V, ventricle; Ctrl, control; DM, dorsomorphin. Dashed lines outline the hearts. |

FUCCI as a cardiomyocyte proliferation indicator during ventricle regeneration. (A-G) Confocal stack projections of Tg(vmhc:mCherry-NTR; myl7:mAG-zGeminin) hearts showed pattern of zGem+ CMs at 3 dpf/0 hpt, which are in the S, G2 and M phases of the cell-cycle (A). Numbers of zGem+ CMs dramatically increased in the atrium of ablated hearts (E-G) compared to control hearts (B-D). (H, I) Quantification of zGem+ CM numbers in the whole heart (H) or in the atrium only (I) of control and ablated groups at 0, 12, 36 and 60 hpt. Mean + SD, N=8-15 for each time point, Student's t-test, **, P <0.01, ***, P < 0.001. (J) Time-lapse images of Tg(myl7:mAG-zGeminin) hearts showed the dynamic pattern of zGem+ CMs during 42-46 hpt. White arrows point to a CM which lost zGem+ signal after division, while orange arrows point to a CM with newly appeared zGem+ signal. Scale bars, (A-G) 50 µm, (J) 20 µm. dpf, days post fertilization; hpt, hours post MTZ treatment; A, atrium; V, ventricle; CM, cardiomyocyte. Dashed lines outline the hearts. |

|

BMP and Notch signaling pathways differentially influence cardiomyocyte cell-cycle progression. (A-F'') Confocal stack projections of Tg(vmhc:mCherry-NTR; myl7:mAG-zGeminin) hearts with immunofluorescence of phospho-histone H3 and EdU showed proliferating CMs in different phases of cell cycle in control or ablated groups at 24, 48 and 72 hpt. (F', F”) magnified red and blue box areas in F. White arrowheads point to EdU+/ zGem+ CMs, orange arrowheads point to pH3+/ zGem+ CMs. (G-L) Confocal stack projections of Tg(vmhc:mCherry-NTR; myl7:mAG-zGeminin) hearts with immunofluorescence of phospho-histone H3 and EdU in control or ablated groups without or with DAPT or DM treatment at 48 hpt. White arrowheads point to EdU+/ zGem+ CMs, orange arrowheads point to pH3+/ zGem+ CMs. (M-P) Quantification of EdU+/zGem+ (M), pH3+/zGem+ (N), and zGem+ only (O) CM number in control or ablated groups without or with DAPT or DM treatment at 48 hpt. The respective proportions in total zGem+ CMs were shown in P. Mean + SD, N=12-18 for each group, Student's t-test, *, P < 0.05, **, P < 0.01, ***, P < 0.001. Scale bars, (A-L) 50 µm, (F', F”) 20 µm. hpt, hours post MTZ-treatment; A, atrium; V, ventricle; CM, cardiomyocyte; DM, dorsomorphin. Dashed lines outline the hearts. |