
- Title
-
Pharmacological Modulation of Serotonin Levels in Zebrafish Larvae: Lessons for Identifying Environmental Neurotoxicants Targeting the Serotonergic System
- Authors
- Faria, M., Prats, E., Bellot, M., Gomez-Canela, C., Raldúa, D.
- Source
- Full text @ Toxics
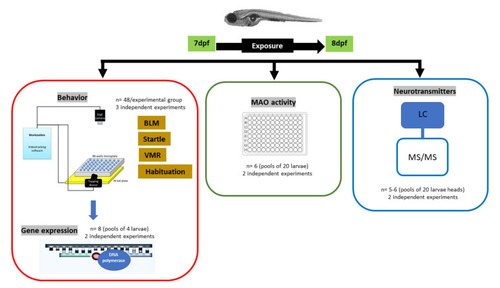
Diagram of the conducted study, indicating the exposure period (from 7 to 8 dpf) and the addressed variables (behavior, gene expression, MAO activity, and neurotransmitters), divided into their corresponding dataset (red, green, and blue squares). Indicated are also the number of larvae and independent experiments used for each variable. |
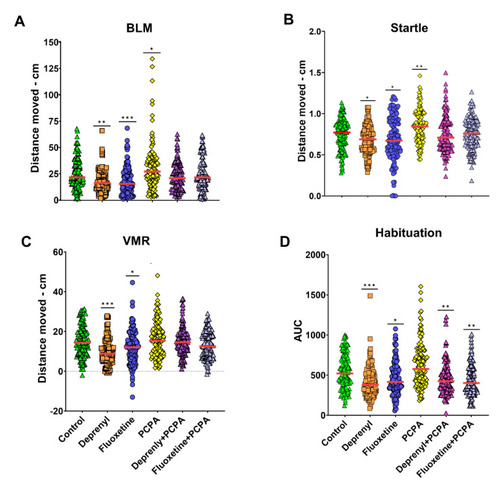
Behavioral changes on zebrafish 8 dpf old larvae, following 24 h waterborne exposure to 5 µM Deprenyl, 0.5 µM Fluoxetine, 2.5 mM PCPA, and the combination of 2.5 mM PCPA with either Deprenyl 5 µM or Fluoxetine 0.5 µM. (A) Basal locomotor (BLM) activity, represented as the total distance (cm) travelled during 10 min (n = 126–132); (B) acoustic/vibrational escape response (startle), represented as the total distance (cm) travelled following the delivery of a tapping stimulus (n = 127–133); (C) visual-motor response (VMR), representing the response of larvae due to transition of light to dark, represented as the difference of the total distance (cm) travelled by larvae during two minutes after and before the transition of light to dark (n = 121–126); (D) habituation of the acoustic/vibrational escape response evoked by a series of 50 tapping stimulus delivered every second represented as area under the curve (AUC) of larvae responses (n = 124–132). Data are from 3 independent experiments and are reported as scatter plots with the median (red line). Significance was set to p < 0.05 and can be represented as * when p < 0.05; ** when p < 0.01 and *** when p < 0.001, Kruskal–Wallis non-parametric test. PHENOTYPE:
|
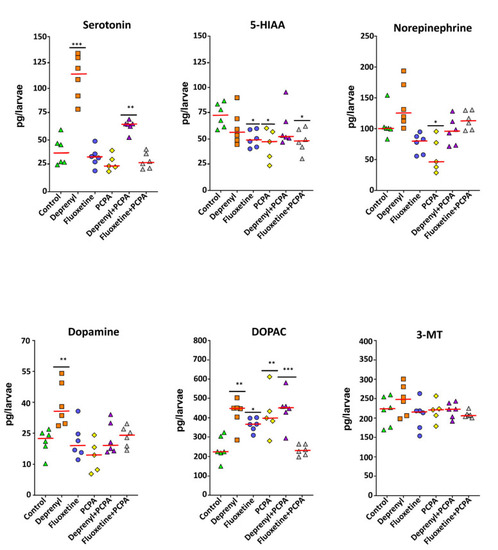
Monoaminergic neurotransmitter profiles of heads of zebrafish exposed to 5 µM Deprenyl, 0.5 µM Fluoxetine, 2.5 mM PCPA, and the combination of 2.5 mM PCPA with either Deprenyl 5 µM or Fluoxetine 0.5 µM. Data are reported as scatter plots with the median (red line) and n = 5–6 for all treatment groups. Significance was set to p < 0.05 and can be represented as * when p < 0.05; ** when p < 0.01 and *** when p < 0.001, one-way ANOVA with Dunnett’s multiple comparison test. PHENOTYPE:
|

Effects over gene and enzyme activity levels in whole body of 8 dpf old zebrafish larvae following pharmacological modulation of the serotonergic system. (A) Expression of tph1α involved in serotonin synthesis process; (B,C) Expression of mao and MAO activity, respectively, involved in the degradation of serotonin; (D) Expression of sert and vmat2 genes that respectively regulate serotonin transport from the synaptic cleft back to the presynaptic neuron and the transport of serotonin form the cell cortisol into synaptic vesicles. Data are from 2 independent experiments and are reported as scatter plots with the median (red line) and n = 6–8 for all treatment groups. Significance was set to p < 0.05 and can be represented as * when p < 0.05; ** when p < 0.01 and *** when p < 0.001, one-way ANOVA with Dunnett’s multiple comparison test. |