
Image
|
Figure Caption
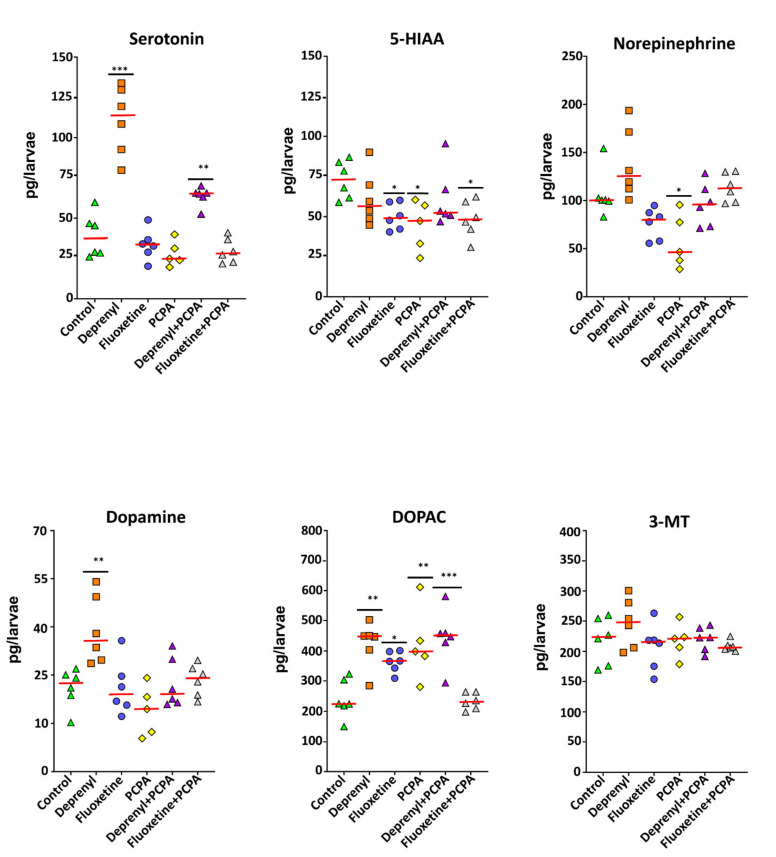
Figure 3 Monoaminergic neurotransmitter profiles of heads of zebrafish exposed to 5 µM Deprenyl, 0.5 µM Fluoxetine, 2.5 mM PCPA, and the combination of 2.5 mM PCPA with either Deprenyl 5 µM or Fluoxetine 0.5 µM. Data are reported as scatter plots with the median (red line) and n = 5–6 for all treatment groups. Significance was set to p < 0.05 and can be represented as * when p < 0.05; ** when p < 0.01 and *** when p < 0.001, one-way ANOVA with Dunnett’s multiple comparison test.
Acknowledgments
This image is the copyrighted work of the attributed author or publisher, and
ZFIN has permission only to display this image to its users.
Additional permissions should be obtained from the applicable author or publisher of the image.
Full text @ Toxics