FIGURE SUMMARY
Title

Rational construction of a reversible arylazo-based NIR probe for cycling hypoxia imaging in vivo

Authors
Zhang, Y., Zhao, W., Chen, Y., Yuan, H., Fang, H., Yao, S., Zhang, C., Xu, H., Li, N., Liu, Z., Guo, Z., Zhao, Q., Liang, Y., He, W.
Source
Full text @ Nat. Commun.

Reversible imaging mechanism and behavior of HDSF.

a Normal azobenzene-derived fluorescent probes for hypoxia and their reductive decomposition of N–N bond by the hypoxic microenvironment in living systems. b The reversible hypoxia sensing mechanism of probe HDSF. The square and fluorophore in black represent the quenched-fluorophore, and those in bright magenta represent the emitting-fluorophore. c Fluorescent spectra of 20 μM HDSF in PBS buffer (0.1 M, pH 7.4, 2% DMSO, v/v) containing rat liver microsomes (RLM, 250 μg mL−1) and NADPH (100 μM) recorded in normoxia-hypoxia cycles. d Fluorescence intensity of HDSF at 705 nm detected in (c). e Fluorescent spectra of 20 μM HDMA in PBS buffer (0.1 M, pH 7.4, 2% DMSO, v/v) containing RLM (250 μg mL−1) and NADPH (100 μM) recorded in normoxia-hypoxia cycles. f Fluorescence intensity of HDMA at 709 nm detected in (e). Ctrl: PBS buffer with RLM and NADPH. λex, 650 nm.

The reversible reaction of HDSF in hypoxia-reoxygenation cycle.

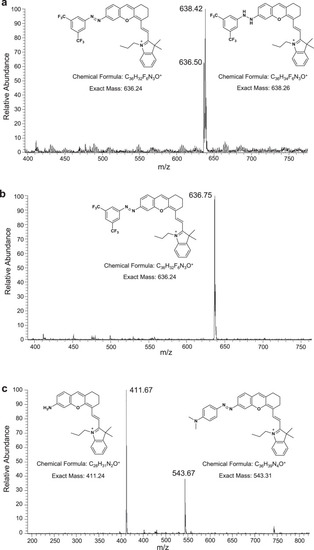
ESI-MS spectra of probe solutions (20 μM in PBS buffer) incubated with RLM (250 μg mL−1) and NADPH (100 μM), a HDSF incubated in hypoxic condition. The supernatant of the reaction solution was directly used for detection. b HDSF solution exposed in the air after incubated in the hypoxic environment. c HDMA incubated in hypoxic condition. Solutions of (b) and (c) were quenched with MeCN, then vortexed and centrifuged, and the organic layers were used for detection respectively.

DFT-calculated free energies for the reduction processes of HDSF and HDMA.

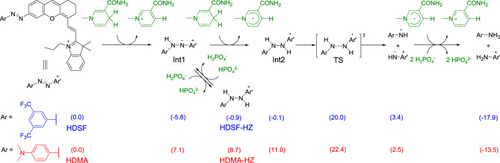
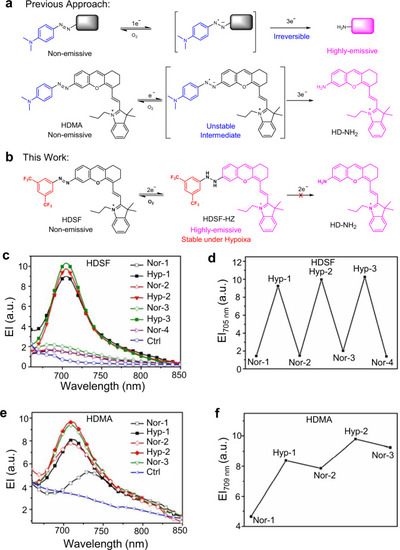
Numbers in parentheses are in kcal/mol, which are free energies of HDSF reduction intermediates and products (blue color) or HDMA reduction intermediates and products (red color).

Mitochondria targeting, hypoxia imaging sensitivity, and reversibility in cells.

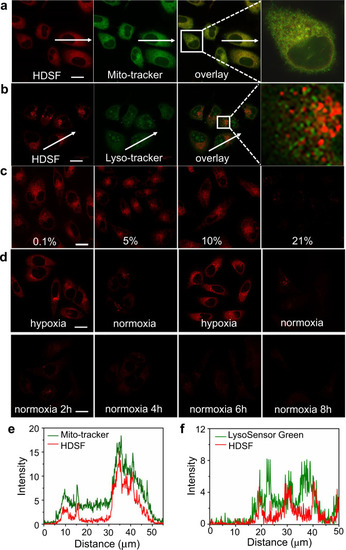
Confocal fluorescence images of MCF-7 cells co-stained with 2 μM HDSF and Mito-Tracker Green (a) or HDSF and LysoSensor Green DND-189 (b) in hypoxia conditions (0.1% O2). The red channel image was obtained with a band path of 640–750 nm upon excitation at 633 nm, and the green channel image was obtained with a band path of 492–630 nm upon excitation at 488 nm. Fluorescence profiles along the white arrow from the red channel and green channel are in diagram e (according to a) and diagram f (according to b). c Fluorescence images of HDSF-stained MCF-7 cells incubated in conditions with different O2 contents. d Fluorescence images of MCF-7 cells stained with HDSF in hypoxia-normoxia cycles and in normoxia environment. The results are representative of three biologically independent experiments. Scale bars: 20 μm. Source data are available as a Source data file.

Reversible hypoxia imaging in zebrafish.

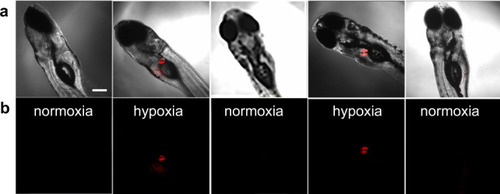
Confocal imaging of a 6-day-old zebrafish embryos injected with 2 nL HDSF (2 μM). Images were collected for zebrafish embryos underwent water rinse (normoxia) and BDM (15 mM, 5 min) treatment (hypoxia) successively in cycle. a Overlaps of bright field and fluorescence images, b fluorescence images. The results are representative of three biologically independent experiments. λex, 633 nm. Scale bars: 200 μm.

Tumoral hypoxia imaging in mice.

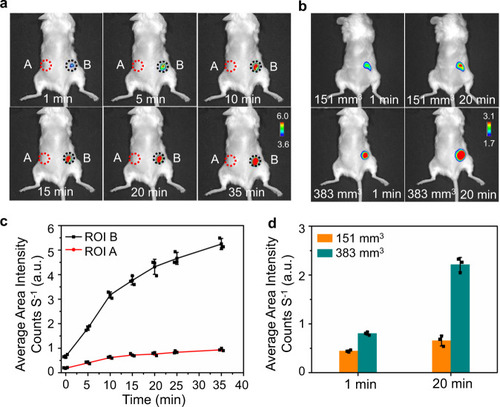
Optical imaging of human breast MCF-7 tumor-xenografted mice injected with HDSF (20 μM, 50 μL). a Images (overlaps of fluorescence and bright-field images) of a mouse underwent subcutaneously (ROI A) and intratumoral (ROI B) HDSF-injection recorded at different time post injection; b images of mice bearing tumors of different size (~151 and 383 mm3) recorded at first or 20th min post intratumoral HDSF-injection; c temporal profile of fluorescence in ROIs A and B in (a); d histogram of fluorescence in tumors in (b). Data were presented as mean ± SD. The results are representative of three independent experiments. λex, 660 nm; λem, 710 nm. Source data are available as a Source data file.

Hypoxia-reoxygenation imaging in mice hind limb.

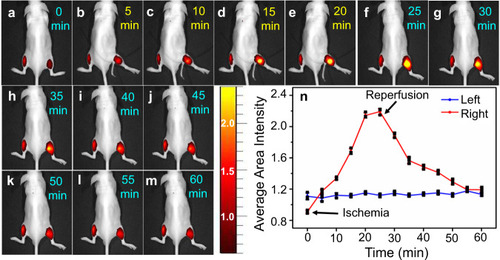
Optical imaging of cycling hypoxia in ischemia-reperfusion process in a living mouse via intramuscular injection of HDSF (20 μM, 50 μL, 20 min) in the two hind limbs. The ischemia-reperfusion process was simulated via treating the right limb with a tourniquet for 25 min followed by removing the tourniquet thereafter. am images for mouse recorded every 5 min in the ischemia-reperfusion process (1 h); n temporal profiles for average fluorescence intensity in the left (blue) and right (red) limbs. Data were presented as mean ± SD. The results are representative of three independent experiments. λex, 660 nm; λem, 710 nm. Source data are available as a Source data file.

Acknowledgments
This image is the copyrighted work of the attributed author or publisher, and ZFIN has permission only to display this image to its users. Additional permissions should be obtained from the applicable author or publisher of the image. Full text @ Nat. Commun.