IMAGE

Fig. 4

ID
ZDB-IMAGE-210519-19
Source
Figures for Zhang et al., 2021
Image
Figure Caption

Fig. 4 Mitochondria targeting, hypoxia imaging sensitivity, and reversibility in cells.

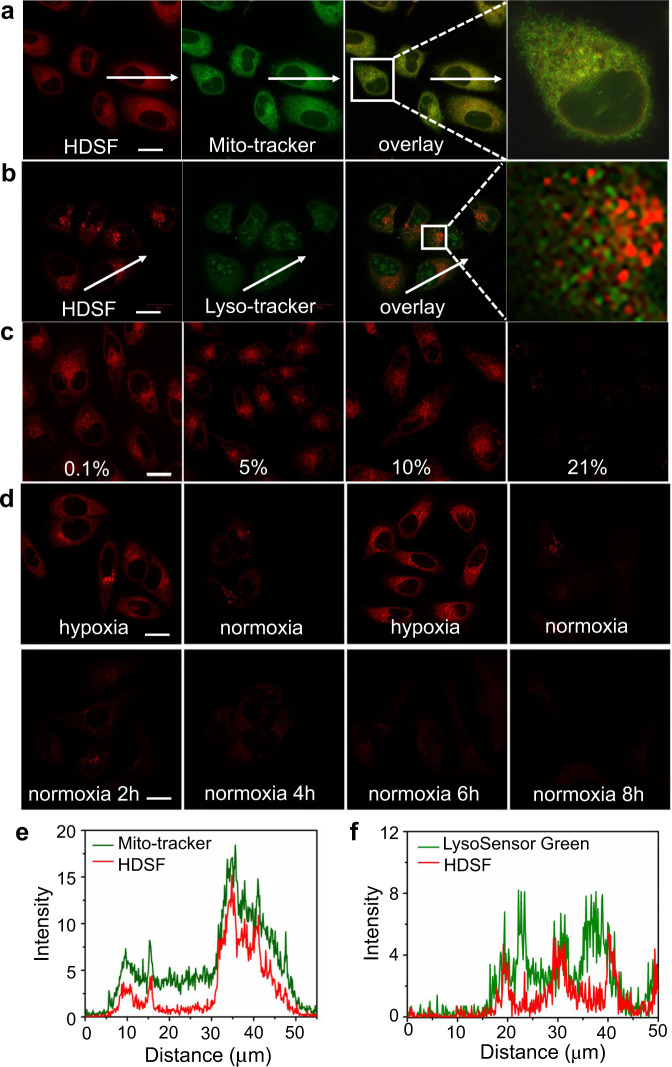
Confocal fluorescence images of MCF-7 cells co-stained with 2 μM HDSF and Mito-Tracker Green (a) or HDSF and LysoSensor Green DND-189 (b) in hypoxia conditions (0.1% O2). The red channel image was obtained with a band path of 640–750 nm upon excitation at 633 nm, and the green channel image was obtained with a band path of 492–630 nm upon excitation at 488 nm. Fluorescence profiles along the white arrow from the red channel and green channel are in diagram e (according to a) and diagram f (according to b). c Fluorescence images of HDSF-stained MCF-7 cells incubated in conditions with different O2 contents. d Fluorescence images of MCF-7 cells stained with HDSF in hypoxia-normoxia cycles and in normoxia environment. The results are representative of three biologically independent experiments. Scale bars: 20 μm. Source data are available as a Source data file.

Acknowledgments
This image is the copyrighted work of the attributed author or publisher, and ZFIN has permission only to display this image to its users. Additional permissions should be obtained from the applicable author or publisher of the image. Full text @ Nat. Commun.