
- Title
-
Soybean Meal-Dependent Intestinal Inflammation Induces Different Patterns of Bone-Loss in Adult Zebrafish Scale
- Authors
- Carnovali, M., Valli, R., Banfi, G., Porta, G., Mariotti, M.
- Source
- Full text @ Biomedicines

Morphometric and infiltrate analysis of the gut wall. Fish were fed with a soy-supplemented diet for one (T1), two (T2), three (T3), four (T4), and five (T5) weeks or normal diet (CTR). (A) The total wall thickness was found increased after two and three weeks of treatment (T2 vs. CTR, p < 0.001; T3 vs. CTR, p < 0.05). (B) The percentage of MPO-positive immune cells was found increased in the submucosal layer of SBM-treated fish starting from T2 (T2 vs. CTR, p < 0.001; T3 vs. CTR, p < 0.001; T4 vs. CTR, p < 0.001; T5 vs. CTR, p < 0.01). Significance values were set at less than p < 0.05 (*), p < 0.01 (**), and p < 0.001 (***). |

Gene expression analysis by RT-PCR for inflammatory marker genes on zebrafish intestine untreated (CTR) or treated with SBM for one (T1), two (T2), three (T3), four (T4), and five weeks (T5). IL-6, IL-10, TGFβ, IL-1β, IL-8, and TNFα resulted to be statistically significantly increased after two weeks (IL-1β: CTR vs. T2, p < 0.001; IL-8: CTR vs. T2, p < 0.001; IL-10: CTR vs. T2, p < 0.001; TGFβ: CTR vs. T2, p < 0.001; IL-6: CTR vs. T2, p < 0.001; TNFα: CTR vs. T2, p < 0.05) and IL-8 and TNFα after three weeks (IL-8: CTR vs. T3, p < 0.05; TNFα: CTR vs. T3, p < 0.01). After four and five weeks of treatment, only IL-8 resulted to be significantly increased (IL-8: CTR vs. T4, p < 0.001 and IL-8: CTR vs. T5, p < 0.001, respectively). Significance values were set at less than p < 0.05 (*), p < 0.01 (**), and p < 0.001 (***). |
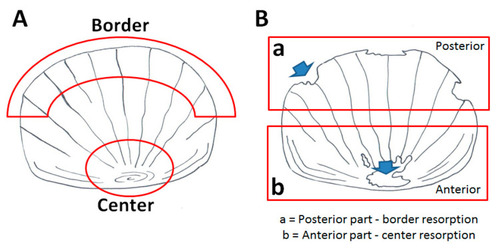
Schematic representation of the adult zebrafish scale (A) The “center” is located in the anterior part of the scale, whereas the “border” is in the posterior part. (B) Resorption lacunae in the posterior part are distributed along the border, while in the anterior part, they are concentrated in the center. |
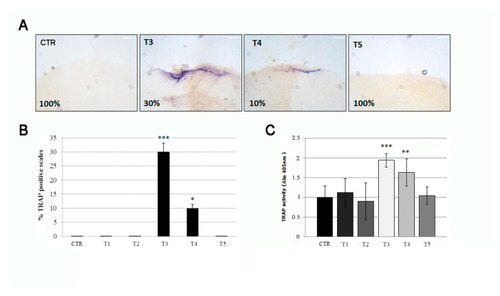
(A) The histological TRAP activity assay highlighted resorption activity along the anterior border of the scale after 3 (T3) and 4 (T4) weeks of treatment, whereas no activity was found in the scales of untreated fish (CTR), T1 (not shown), T2 (not shown), and T5. The percentage indicates the representation of the picture phenotype respect the total scales (scale bar: 0.1 mm). (B) The percentage of scales with detectable TRAP activity staining was 30% and 10%, respectively, at T3 and T4 (CTR vs. T3, p < 0.001; CTR vs. T4, p < 0.05). The value of the control at each experimental point was omitted, as it was identical to the initial CTR. (C) The biochemical TRAP activity assay indicated a peak in resorption activity in the scale after 3 weeks (T3) (CTR vs. T3, p < 0.001). Then it rapidly decreased at T4 (CTR vs. T4, p < 0.01) and returned to the control level at T5. The value of the control at each experimental point was omitted, as it was identical to the initial CTR. Significance values were set at less than p < 0.05 (*), p < 0.01 (**), and p < 0.001 (***). |

(A) Calcein vital staining of scales from treated fish and untreated controls. Control scale show normal profile, while scales from treated fish show bone resorption lacunae after 3 weeks of treatment (T3, white arrowhead). At 4 weeks of SBM treatment, the lacunae started to fill by new matrix deposition (T4, white arrows) and appeared completely repaired in the fifth week (T5) (scale bar: 0.1 mm). (B) Percentage of resorbed scales versus repaired scales. The percentage of resorbed scales decreased as the percentage or repaired scales increased (resorbed scales: CTR vs. T3, p < 0.001; CTR vs. T4, p < 0.05; repaired scales: CTR vs. T4, p < 0.001; CTR vs. T5, p < 0.001). (C) Alizarin Red-calcein double staining shows that the resorbed area was completely filled by new matrix at the end of the fifth week (green signal in T5) of SBM treatment in all scales. Untreated control (CTR) is shown as reference (scale bar: 0.07 mm). (D) Biochemical ALP activity assay indicates a peak in anabolic activity in the scale after 3 weeks of treatment (T3) (CTR vs. T3, p < 0.001). The value of the control at each experimental point was omitted as it was identical to the initial CTR. Significance values were set at less than p < 0.05 (*), and p < 0.001 (***). |

(A) Histological TRAP activity assay highlights resorption activity along the central area of the scale after 3 (T3), 4 (T4), and 5 (T5) weeks of treatment, whereas no activity is found in the scales of untreated fish (CTR), T1 (not shown) and T2 (not shown) (scale bar: 0.1 mm). (B) The percentage of scale with detectable TRAP activity staining is 50%, 70% and 80% respectively at T3, T4 and T5 (CTR vs. T3, p < 0.001; CTR vs. T4, p < 0.001 CTR vs. T5, p < 0.001). The value of the control at each experimental point was omitted as it was identical to the initial CTR. (C) Biochemical TRAP activity assay indicates a significant resorption activity in the center of scales after 4 and 5 weeks (T4 and T5) (CTR vs. T4, p < 0.01; CTR vs. T5, p < 0.001). The value of the control at each experimental point was omitted as it was identical to the initial CTR. Significance values were set at less than p < 0.01 (**), and p < 0.001 (***). |

(A) Calcein vital staining of scales from treated fish and untreated controls. Control scale show normal profile, while scales from treated fish show central resorption lacunae after 3 weeks of treatment (T3, white arrow) (scale bar: 0.1 mm). (B) Biochemical ALP activity assay indicates a downregulation of anabolic activity in the scale after 5 weeks of treatment (T5) (CTR vs. T5, p < 0.001). The value of the control at each experimental point was omitted as it was identical to the initial CTR. (C) Histological ALP assay confirmed the loss of enzymatic activity (white arrows) in the center of scales after 5 weeks of SBM treatment (scale bar: 0.1 mm). Significance values were set at less than p < 0.001 (***). |
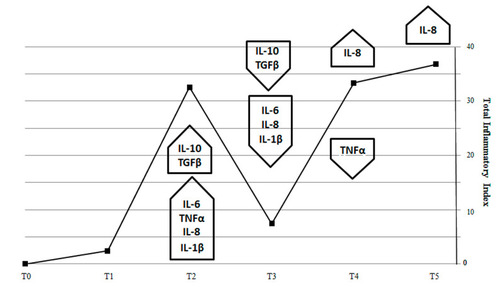
Total inflammatory index (TII) generated by expression of pro-inflammatory (IL-1β, TNF-α, IL-8 and IL-6) and anti-inflammatory (IL-10, TGFβ) genes in fish intestine. Total inflammatory index peaks during the second week of SBM treatment to indicate the maximum activity of pro-inflammatory cytokines (IL-1β, TNF-α, IL-8, and IL-6). Next, TII dropped at T3, because of the effect of the anti-inflammatory cytokines TGFβ and IL-10 and returned to increase in T4 and T5 because of sustained IL-8 expression. |

Correlation between the percentage of TRAP positive scales (center and border) and the total inflammatory index curve. TRAP activity in the scale border follows the inflammatory index peak at T2, while TRAP activity in the center follows the late inflammatory index curve (T4 and T5). |