
Image
|
Figure Caption
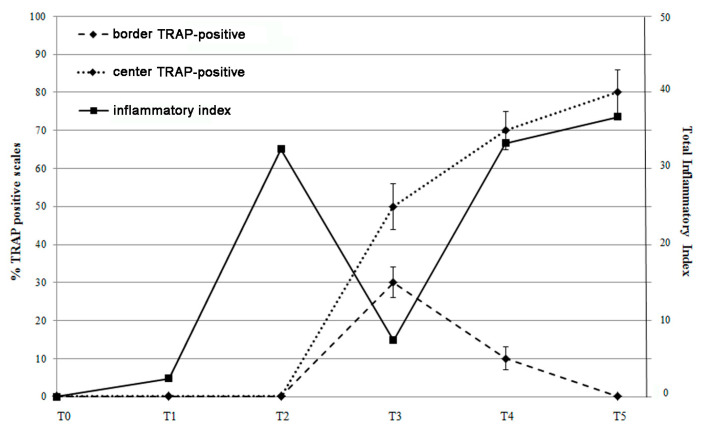
Figure 9 Correlation between the percentage of TRAP positive scales (center and border) and the total inflammatory index curve. TRAP activity in the scale border follows the inflammatory index peak at T2, while TRAP activity in the center follows the late inflammatory index curve (T4 and T5).
Acknowledgments
This image is the copyrighted work of the attributed author or publisher, and
ZFIN has permission only to display this image to its users.
Additional permissions should be obtained from the applicable author or publisher of the image.
Full text @ Biomedicines