
Figure 4
- ID
- ZDB-FIG-210503-116
- Publication
- Carnovali et al., 2021 - Soybean Meal-Dependent Intestinal Inflammation Induces Different Patterns of Bone-Loss in Adult Zebrafish Scale
- Other Figures
- All Figure Page
- Back to All Figure Page
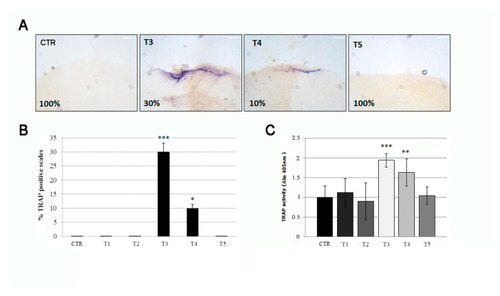
(A) The histological TRAP activity assay highlighted resorption activity along the anterior border of the scale after 3 (T3) and 4 (T4) weeks of treatment, whereas no activity was found in the scales of untreated fish (CTR), T1 (not shown), T2 (not shown), and T5. The percentage indicates the representation of the picture phenotype respect the total scales (scale bar: 0.1 mm). (B) The percentage of scales with detectable TRAP activity staining was 30% and 10%, respectively, at T3 and T4 (CTR vs. T3, p < 0.001; CTR vs. T4, p < 0.05). The value of the control at each experimental point was omitted, as it was identical to the initial CTR. (C) The biochemical TRAP activity assay indicated a peak in resorption activity in the scale after 3 weeks (T3) (CTR vs. T3, p < 0.001). Then it rapidly decreased at T4 (CTR vs. T4, p < 0.01) and returned to the control level at T5. The value of the control at each experimental point was omitted, as it was identical to the initial CTR. Significance values were set at less than p < 0.05 (*), p < 0.01 (**), and p < 0.001 (***). |