
- Title
-
Efficient CRISPR/Cas9 mutagenesis for neurobehavioral screening in adult zebrafish
- Authors
- Klatt Shaw, D., Mokalled, M.H.
- Source
- Full text @ G3 (Bethesda)
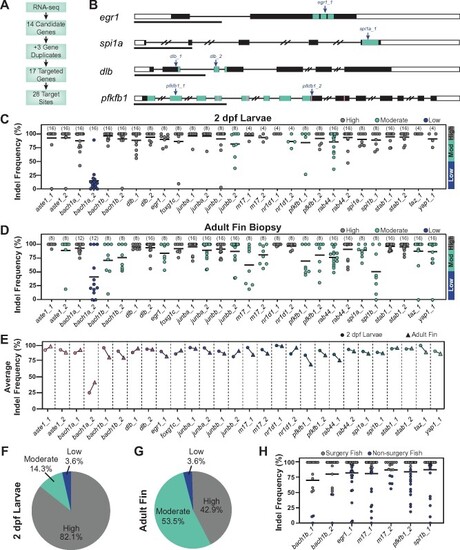
CRISPR/Cas9 dgRNPs effectively mutate genes in adult zebrafish. (A) Schematic summary of gene targeting. A total of 17 genes were targeted using 28 dgRNPs. (B) Representative schematics for dgRNP target genes. Shown are transcription factors egr1 and spi1a, the dlb ligand, and the enzyme pfkfb1 (black boxes, exons; white boxes, UTRs; and lines, introns). Key domains are indicated in teal: zinc finger (egr1) and ETS (spi1a) DNA binding domains, EGF-like domain 1 (dlb), and 6PF2K domain (pfkfb1). The enzymatic active sites are indicated by pink lines in pfkfb1. dgRNP target sites are indicated by blue arrows. Scale bars, 1 Kilobase (Kb). (C, D) Targeting efficiency in dgRNP injected zebrafish crispants by capillary electrophoresis. Data points represent individual animals . Lines indicate means. Sample sizes are indicated between parentheses. 2 dpf larvae (C) or adult caudal fin (D) were analyzed. Target sites are classified as high-efficiency (indel frequency >90%, gray), moderate-efficiency (indel frequency 50–90%, teal), and low-efficiency (indel frequency <50%, blue). (E) Targeting efficiency in larval (circles) and adult (triangles) zebrafish. Data points represent the average indel frequency for each target site. (F, G) Pie chart representation of dgRNP efficiency. Shown are the fractions of dgRNPs with high (gray), moderate (teal), and low (blue) efficiencies. (H) Capillary electrophoresis genotyping of adult animals in which indel frequency decreased between larvae and adults. Data points represent individual animals. Adult fish with indel frequency >90% (gray) were subjected to spinal cord transection and subsequent phenotyping. Because only 16 taz_1/yap_1 dual-targeted animals survived to adulthood, all were genotyped in D. |
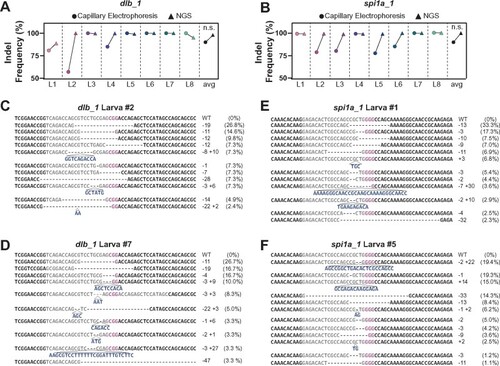
Capillary electrophoresis provides accurate measurement of indel frequencies in zebrafish. (A, B) Comparison of indel frequency calculated by capillary electrophoresis (circles) and NGS (triangles) for dlb_1 (A) and spi1a_1 (B) target sites in 2 dpf larvae. Shown are the average indel frequencies for eight individual larvae (L1-L8) . n.s. indicates P-value >0.05. (C–F) Sample NGS results for two larvae at dlb_1 (L2, C and L7, D) and spi1a_1 (L1, E and L5, F) target sites. Sequence reads represent the wild-type (WT) allele and the mutagenized alleles retrieved at each target site. NGS-derived indel frequencies indicate the percentage of reads mapping to each allele. The target site protospacer is in gray, and the PAM sequence is in magenta. Insertions (navy) and deletions (dashed lines) are indicated. |

Characterization of dgRNP generated alleles (A) Frequency of occurrence of dgRNP generated alleles for dlb_1, junbb_1, and spi1a_1. NGS data shown represents eight larvae at each target site. Y-axis indicates percent larvae; X-axis categorizes the most common alleles based on their indel frequency in individual larvae. (B) Indel size distribution of dgRNP generated alleles for dlb_1, junbb_1, and spi1a_1. NGS data shown represents eight larvae at each target site. Y-axis indicates percent larvae; X-axis indicates indel size (ranging from −100 bp deletions to +50 bp insertions) (C–E) Schematics of dgRNP generated deletions in individual dlb_1 (C), spi1a_1 (D), and junbb_1 (E) larvae. Target site protospacers are shown in gray, and PAM sites in magenta. For each allele, semi-circles indicate base deletion. The weights and opacities of the semi-circles are proportional to the indel frequency of each allele. The heights of the semi-circles are proportional to deletion size. (F) The frequency for the most common allele generated by CRISPR/Cas9 dgRNPs at the spi1a_1 target site in whole 2 dpf larvae (circles) and adult caudal fin (triangles). NGS data shown represents eight animals. The percent of animals with common alleles and the prevalence of reads are shown. (G) Survival curves of 25 uninjected wild-type control (black) and 25 taz/yap1 dgRNP injected (magenta) zebrafish. (H) The indel frequency of all alleles (triangles) and frameshift only alleles (circles) at taz_1 and yap_1 target sites in whole 2 dpf larvae (gray) and adult caudal fins (teal) as measured by capillary electrophoresis. Data points represent individual animals. Indel frequency represents the sum of frequencies at the taz_1 and yap_1 target sites. Sample sizes are indicated. n.s. indicates P > 0.05; *P < 0.05; ****P < 0.0001. |
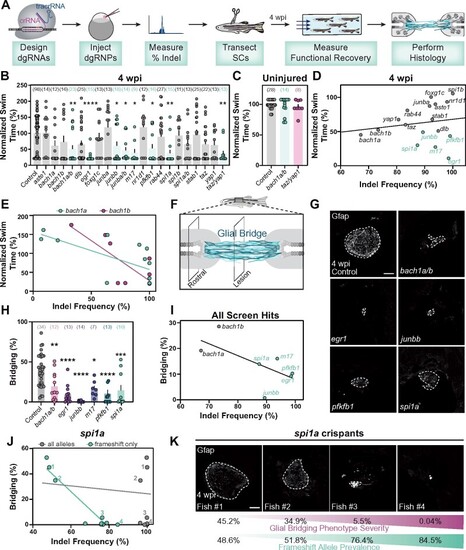
Spinal cord regeneration defects in dgRNP targeted zebrafish. (A) Schematic pipeline to screen for spinal cord regeneration phenotypes in dgRNP targeted zebrafish crispants. (B) Functional recovery in dgRNP targeted animals 4 wpi. Data points represent individual animals and sample sizes are indicated. For each group of targeted animals, uninjected siblings were subjected to injury and swim assays. Swim times were normalized to their respective wild-type siblings. Groups with significantly diminished swim function are shown in teal. (C) Quantification of swim function in uninjured bach1a/b and taz/yap1 targeted crispants. Data points represent individual animals and sample sizes are indicated. (D) Functional recovery relative to indel frequency (as measured by capillary electrophoresis) for each targeted gene at 4 wpi. Crispants with significant functional recovery defects are shown in teal. For genes that were targeted at more than one site, indel frequency is averaged across both sites. (E) Functional recovery relative to indel frequency for bach1a (teal) and bach1b (magenta) zebrafish at 4 wpi. Data points represent individual animals. The indel frequency is averaged for target sites #1 and #2, since bach1a and bach1b were targeted at two sites each. (F) Schematic of regenerating zebrafish spinal cord. Bridging glia are shown in teal. Percent bridging was calculated as the ratio of the cross-sectional areas of the glial bridge (lesion) and the area of the intact spinal cord (rostral). (G, H) Glial bridging at 4 wpi. Representative immunohistochemistry shows Gfap+ bridges at the lesion site in bach1a/b, egr1, junbb, pfkfb1, and spi1a animals. Percent bridging was quantified for seven to 14 animals per group. (I) Glial Bridging relative to average indel frequency for each gene (as measured by capillary electrophoresis). Data points represent individual genes. Crispants with significantly diminished bridging are shown in teal. Percent bridging was only measured for crispants that displayed a swim phenotype (B), with the exception of bach1a and bach1b single crispants. For genes that were targeted at more than one site, indel frequency was averaged across both sites. (J) Glial bridging relative to indel frequency (as measured by NGS) for spi1a animals. Data points represent individual animals. Gray dots represent indel frequency of all nonwild-type alleles. Teal dots represent indel frequency of nonwild-type alleles predicted to generate frameshift mutations. Linear regression lines are statistically different (P < 0.0001). (K) Representative immunohistochemistry shows Gfap+ glial bridges in spi1a crispants at 4 wpi. Fish 1 through 4 are indicated in panel J. Percent Bridging (magenta) is indicated for each fish along with the frameshift-only indel frequency (teal). For bar plots (B, C, and H), the bar indicates the mean ± SEM. *P < 0.05; **P < 0.01; ***P < 0.001; ****P < 0.0001. Scale bars, 50 μm. |
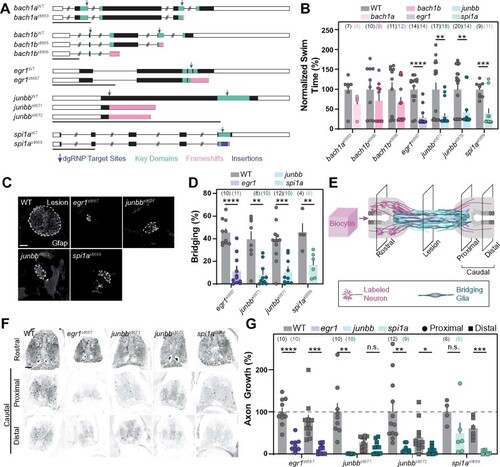
Stable homozygous mutants recapitulate the spinal cord regeneration defects observed in dgRNP crispants. (A) Germline mutations generated in bach1a, bach1b, egr1, junbb, and spi1a. Black boxes are exons, white boxes are UTRs, and lines are introns. Key domains are indicated in teal. dgRNP target sites are indicated by blue arrows. Predicted frameshift mutations are indicated in pink. A 23 bp insertion in spi1a is indicated in violet. (B) Functional recovery in stable homozygous mutant lines at 4 wpi. Data points represent individual animals. Sample sizes are indicated. For each clutch of siblings, mutant swim times were normalized to their wild-type siblings. (C, D) Glial bridging at 4 wpi. Representative immunohistochemistry shows Gfap+ bridges at the lesion site in egr1, junbb, and spi1a mutants. Percent bridging was quantified for 4–12 animals per group. Data points represent individual animals in (D). Sample sizes are indicated. (E) Anterograde axon biocytin labeling paradigm. Biocytin-labeled neurons (magenta) and bridging glia (teal) are schematized. Axon growth caudal to lesion (proximal and distal) was normalized to the efficiency of biocytin labeling rostral to the lesion (rostral) for each fish. (F, G) Anterograde axon labeling of wild-type control siblings and homozygous mutants proximal (circles) and distal (squares) to the lesion site. n.s. indicates P > 0.05; *P < 0.05; **P < 0.01; ***P < 0.001; ****P < 0.0001. Scale bars, 50 μm. |

Efficient CRISPR/Cas9 mutagenesis for neurobehavioral screening in adult zebrafish. dgRNPs were used to achieve high-efficiency mutagenesis in targeted crispants. Swim function was used to identify spinal cord regeneration defects after injury. |