
|
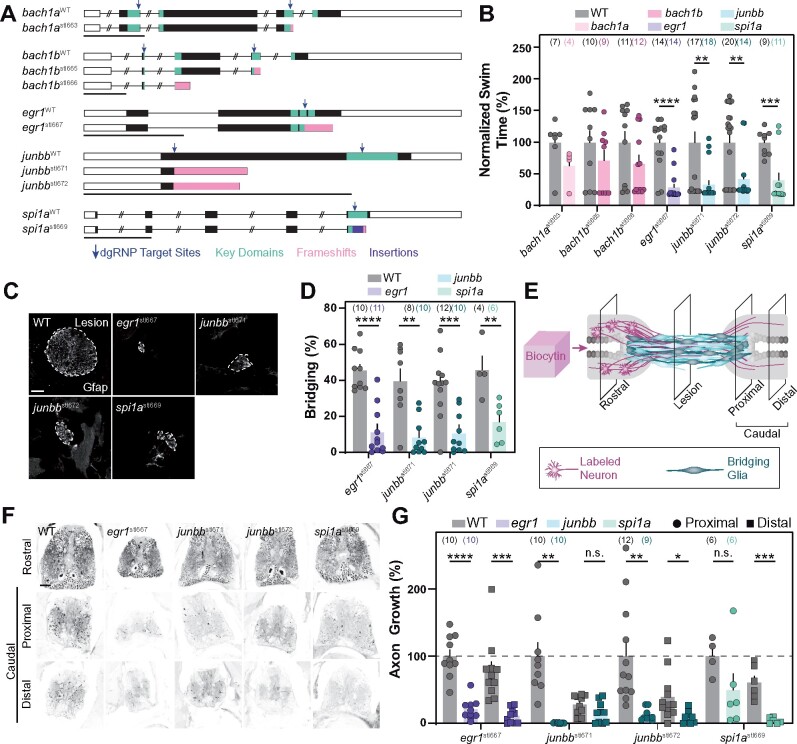
Fig. 5
Stable homozygous mutants recapitulate the spinal cord regeneration defects observed in dgRNP crispants. (A) Germline mutations generated in bach1a, bach1b, egr1, junbb, and spi1a. Black boxes are exons, white boxes are UTRs, and lines are introns. Key domains are indicated in teal. dgRNP target sites are indicated by blue arrows. Predicted frameshift mutations are indicated in pink. A 23 bp insertion in spi1a is indicated in violet. (B) Functional recovery in stable homozygous mutant lines at 4 wpi. Data points represent individual animals. Sample sizes are indicated. For each clutch of siblings, mutant swim times were normalized to their wild-type siblings. (C, D) Glial bridging at 4 wpi. Representative immunohistochemistry shows Gfap+ bridges at the lesion site in egr1, junbb, and spi1a mutants. Percent bridging was quantified for 4–12 animals per group. Data points represent individual animals in (D). Sample sizes are indicated. (E) Anterograde axon biocytin labeling paradigm. Biocytin-labeled neurons (magenta) and bridging glia (teal) are schematized. Axon growth caudal to lesion (proximal and distal) was normalized to the efficiency of biocytin labeling rostral to the lesion (rostral) for each fish. (F, G) Anterograde axon labeling of wild-type control siblings and homozygous mutants proximal (circles) and distal (squares) to the lesion site. n.s. indicates P > 0.05; *P < 0.05; **P < 0.01; ***P < 0.001; ****P < 0.0001. Scale bars, 50 μm.