
|
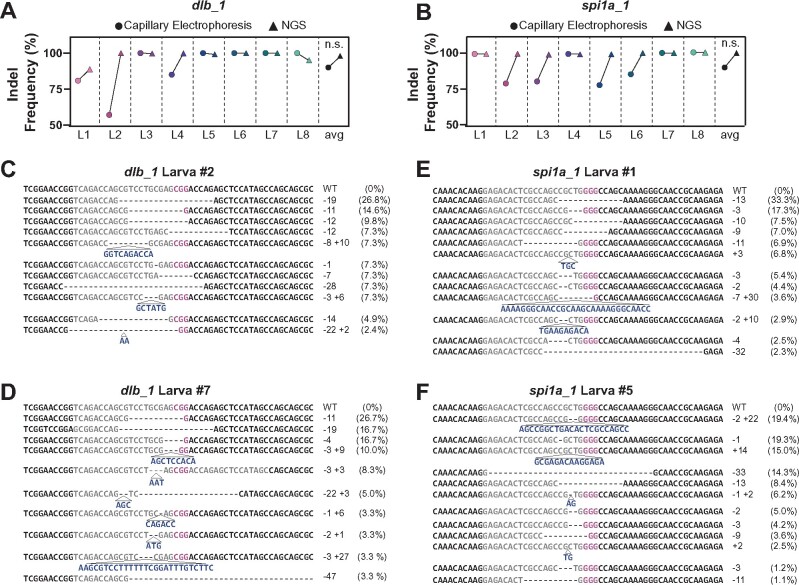
Fig. 2
Capillary electrophoresis provides accurate measurement of indel frequencies in zebrafish. (A, B) Comparison of indel frequency calculated by capillary electrophoresis (circles) and NGS (triangles) for dlb_1 (A) and spi1a_1 (B) target sites in 2 dpf larvae. Shown are the average indel frequencies for eight individual larvae (L1-L8) . n.s. indicates P-value >0.05. (C–F) Sample NGS results for two larvae at dlb_1 (L2, C and L7, D) and spi1a_1 (L1, E and L5, F) target sites. Sequence reads represent the wild-type (WT) allele and the mutagenized alleles retrieved at each target site. NGS-derived indel frequencies indicate the percentage of reads mapping to each allele. The target site protospacer is in gray, and the PAM sequence is in magenta. Insertions (navy) and deletions (dashed lines) are indicated.