
Fig. 4
- ID
- ZDB-FIG-221229-28
- Publication
- Klatt Shaw et al., 2021 - Efficient CRISPR/Cas9 mutagenesis for neurobehavioral screening in adult zebrafish
- Other Figures
- All Figure Page
- Back to All Figure Page
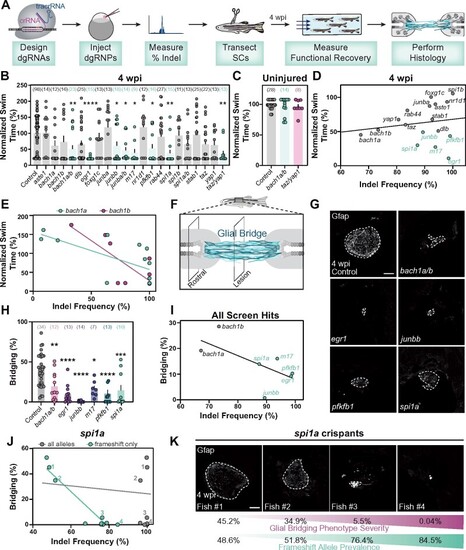
Spinal cord regeneration defects in dgRNP targeted zebrafish. (A) Schematic pipeline to screen for spinal cord regeneration phenotypes in dgRNP targeted zebrafish crispants. (B) Functional recovery in dgRNP targeted animals 4 wpi. Data points represent individual animals and sample sizes are indicated. For each group of targeted animals, uninjected siblings were subjected to injury and swim assays. Swim times were normalized to their respective wild-type siblings. Groups with significantly diminished swim function are shown in teal. (C) Quantification of swim function in uninjured bach1a/b and taz/yap1 targeted crispants. Data points represent individual animals and sample sizes are indicated. (D) Functional recovery relative to indel frequency (as measured by capillary electrophoresis) for each targeted gene at 4 wpi. Crispants with significant functional recovery defects are shown in teal. For genes that were targeted at more than one site, indel frequency is averaged across both sites. (E) Functional recovery relative to indel frequency for bach1a (teal) and bach1b (magenta) zebrafish at 4 wpi. Data points represent individual animals. The indel frequency is averaged for target sites #1 and #2, since bach1a and bach1b were targeted at two sites each. (F) Schematic of regenerating zebrafish spinal cord. Bridging glia are shown in teal. Percent bridging was calculated as the ratio of the cross-sectional areas of the glial bridge (lesion) and the area of the intact spinal cord (rostral). (G, H) Glial bridging at 4 wpi. Representative immunohistochemistry shows Gfap+ bridges at the lesion site in bach1a/b, egr1, junbb, pfkfb1, and spi1a animals. Percent bridging was quantified for seven to 14 animals per group. (I) Glial Bridging relative to average indel frequency for each gene (as measured by capillary electrophoresis). Data points represent individual genes. Crispants with significantly diminished bridging are shown in teal. Percent bridging was only measured for crispants that displayed a swim phenotype (B), with the exception of bach1a and bach1b single crispants. For genes that were targeted at more than one site, indel frequency was averaged across both sites. (J) Glial bridging relative to indel frequency (as measured by NGS) for spi1a animals. Data points represent individual animals. Gray dots represent indel frequency of all nonwild-type alleles. Teal dots represent indel frequency of nonwild-type alleles predicted to generate frameshift mutations. Linear regression lines are statistically different (P < 0.0001). (K) Representative immunohistochemistry shows Gfap+ glial bridges in spi1a crispants at 4 wpi. Fish 1 through 4 are indicated in panel J. Percent Bridging (magenta) is indicated for each fish along with the frameshift-only indel frequency (teal). For bar plots (B, C, and H), the bar indicates the mean ± SEM. *P < 0.05; **P < 0.01; ***P < 0.001; ****P < 0.0001. Scale bars, 50 μm. |
| Gene: | |
|---|---|
| Antibody: | |
| Fish: | |
| Condition: | |
| Knockdown Reagents: | |
| Anatomical Term: | |
| Stage: | Adult |