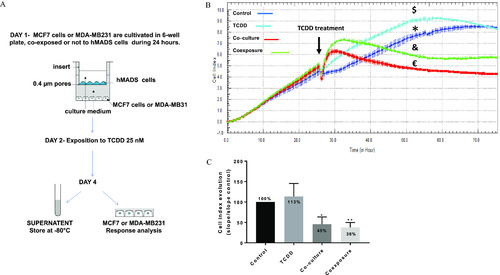
Co-culture model and real time MCF7 cells analysis. (A) Presentation of the 2D co-culture system and the protocol. (B) xCELLigence dynamic monitoring of MCF-7 cells, A representative graph from xCELLigence system: cell index (CI) profiles are the mean±SD (duplicate) of each condition: Control (*, vehicle MCF-7 cells, alone), TCDD ($, MCF-7 cells treated with 25 nM TCDD), co-culture (, MCF-7 co-cultured with hMADS) and coexposure (&, co-culture with TCDD). (C) The evolution of the CI for each condition was determined by analyzing the slope of the line in the interval (26–48 h). Each graph represents the mean slope (in bold) compared with the control±SEM for six measurements. The numerical information mean±SEM and p-values are provided in Table S1. (Kruskal–Wallis’s H test (nonparametric comparison of k independent series) followed by a 1-factor ANOVA test (parametric comparison of k independent series), **p<0.01; *p<0.05). Note: ANOVA, analysis of variance; SEM, standard error of the mean; TCDD, 2,3,7,8-tetrachlorodibenzo-p-dioxin.

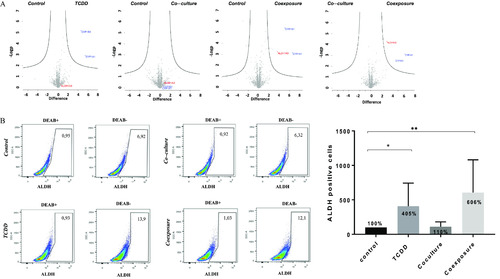
Proteomics analysis and ALDH enzymatic analysis of MCF7 cells growth in co-culture with hMADS and exposed to 25 nM TCDD for 48 h. (A) High-throughput proteomic analysis of MCF7 cells [Control (vehicle MCF-7 cells, alone), TCDD (MCF-7 cells treated with 25 nM TCDD), co-culture (MCF-7 co-cultured with hMADS), and coexposure (co-culture with TCDD)]. The plots show the mean of biological quadruplicates and technical triplicates for each sample. CYP1A1, CYP1B1, and ALDH1A3 were induced when they appeared in the upper right part of the representation. (B) ALDH (aldehyde dehydrogenase) enzymatic activity was detected in MCF7 cells using the ALDEFLUOR assay (FACS analysis). DEAB was used to inhibit the reaction of ALDH with the ALDEFLUOR reagent, providing a negative control. Percentage of ALDH positive cell was set according to the gate of DEAB control cells. Graph represents means of the percentage of ALDH positive cells (in bold) compared with the control±SEM of six measurements. The numerical information mean±SEM and p-values are provided in Table S2. (Kruskal–Wallis’s H test (nonparametric comparison of k independent series) followed by a 1-factor ANOVA test (parametric comparison of k independent series, **p<0.01; *p<0.05). Note: ANOVA, analysis of variance; SEM, standard error of the mean; TCDD, 2,3,7,8-tetrachlorodibenzo-p-dioxin.

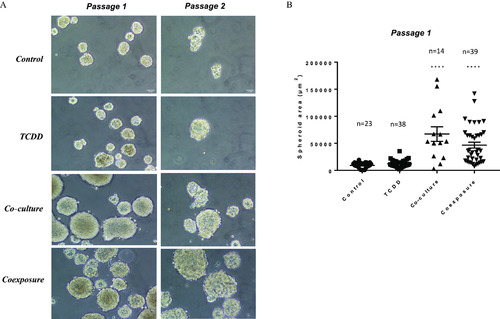
Sphere formation assay. (A) Representative images of sphere formation taken on day 7 on two consecutive generations. Only breast stem/progenitor cells can self-renew and grow into a spheroid structure. Control (vehicle MCF-7 cells, alone), TCDD (MCF-7 cells treated with 25nM TCDD), co-culture (MCF-7 co-cultured with hMADS) and coexposure (co-culture with TCDD). Scale bar 10μm . (B) Spheroid area (in μm2) in passage 1 using media from the various conditions. Graph represents means±SEM of n (see figure) measurements. The numerical information mean±SEM and p-values are provided in Table S3. Untreated MCF-7 cells alone represent the control condition (Kruskal–Wallis’s H test (nonparametric comparison of k independent series) followed by a 1-factor ANOVA test (parametric comparison of k independent series, **** p<0.0001 ). Note: ANOVA, analysis of variance; SEM, standard error of the mean; TCDD, 2,3,7,8-tetrachlorodibenzo-p-dioxin.

Morphological differences of MCF7 cells and MDA-MB-231 cells following exposure to TCDD, co-culture, or coexposure. Cells were grown with hMADS and/or treated with 25 nM TCDD [Control (vehicle MCF-7 cells, alone), TCDD (MCF-7 cells treated with 25nM TCDD), co-culture (MCF-7 co-cultured with hMADS), and coexposure (co-culture with TCDD)]. After 48 h treatment, cells were fixed and stained for paxillin, actin, and nucleus (blue). (A) Staining of MCF7 cells. Scale bar 20μm. (B) Quantitation of MCF7 cell number and giant cells (very large cells with multiple nuclei) per field (n=3) field per conditions. Graph represents means±SEM of three experiments. The numerical information mean±SEM and p-values are provided in Table S4. Kruskal–Wallis’s H test (nonparametric comparison of k independent series) followed by a 1-factor ANOVA test (parametric comparison of k independent series, *p<0.05). (C) Staining of MDA-MB-231. Scale bar 20μm. Symbols were used to point out the focal adhesions (arrow), lamellipods (*) and giant cells (#). Note: ANOVA, analysis of variance; SEM, standard error of the mean; TCDD, 2,3,7,8-tetrachlorodibenzo-p-dioxin.

Protein (A-actin, B-beta-catenin) localization & nucleus staining in MCF7 cells and MDA-MB-231 cells. MCF7 cells were grown with hMADS and/or treated with 25 nM TCDD for 48h [Control (vehicle MCF-7 cells, alone), TCDD (MCF-7 cells treated with 25nM TCDD), co-culture (MCF-7 co-cultured with hMADS), and coexposure (co-culture with TCDD)]. (A) MCF7 cells were stained for actin (green) and nucleus (blue). Scale bar 20μm. (B) MCF7 cells were stained for beta-catenin (green) and nucleus (blue). One representative cell with cell-in-cell structures was marked with an asterisk (*). Scale bar 20μm. Note: TCDD, 2,3,7,8-tetrachlorodibenzo-p-dioxin.

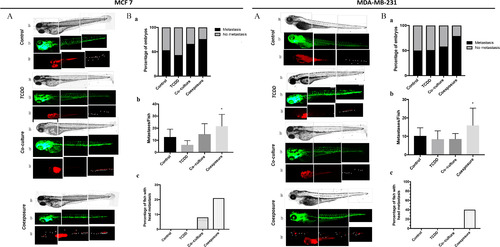
Measurement of metastatic spread of MCF7 and MDA-MB231 cells in zebrafish larvae in vivo models Human RFP-MCF7 (left) or RFP-MDA-MB-231 (right) cells cultured with conditioned media from different conditions, were injected into the perivitelline space of 2-day-old zebrafish larvae [Control (vehicle MCF-7 cells, alone), TCDD (MCF-7 cells treated with 25 nM TCDD), co-culture (MCF-7 co-cultured with hMADS), and coexposure (co-culture with TCDD)]. Fish were imaged 24 h later at 8.5× magnification by fluorescence microscopy. (A) Representative images from 21–46 fish/group. (B) Quantitation of (a) the number of fish with one or more metastases and (b) the average number of metastases/fish+SE. Graph represents means±SEM of three measurements. The numerical information mean±SEM and p-values are provided in Table S8. (Kruskal–Wallis’s H test (nonparametric comparison of k independent series) followed by a 1-factor ANOVA test (parametric comparison of k independent series, * p<0.05). (C) The percentage of fish with metastasis in the head region. Each experiment was repeated in triplicate (MCF-7) or quadruplicate (MDA-MB-231) with 7–12 fish per condition in each experiment. Note: ANOVA, analysis of variance; SEM, standard error of the mean; TCDD, 2,3,7,8-tetrachlorodibenzo-p-dioxin.

Acknowledgments
This image is the copyrighted work of the attributed author or publisher, and ZFIN has permission only to display this image to its users. Additional permissions should be obtained from the applicable author or publisher of the image. Full text @ Environ. Health Perspect.