IMAGE

Figure 1.

ID
ZDB-IMAGE-210311-2
Source
Figures for Koual et al., 2021
Image
Figure Caption

Figure 1.

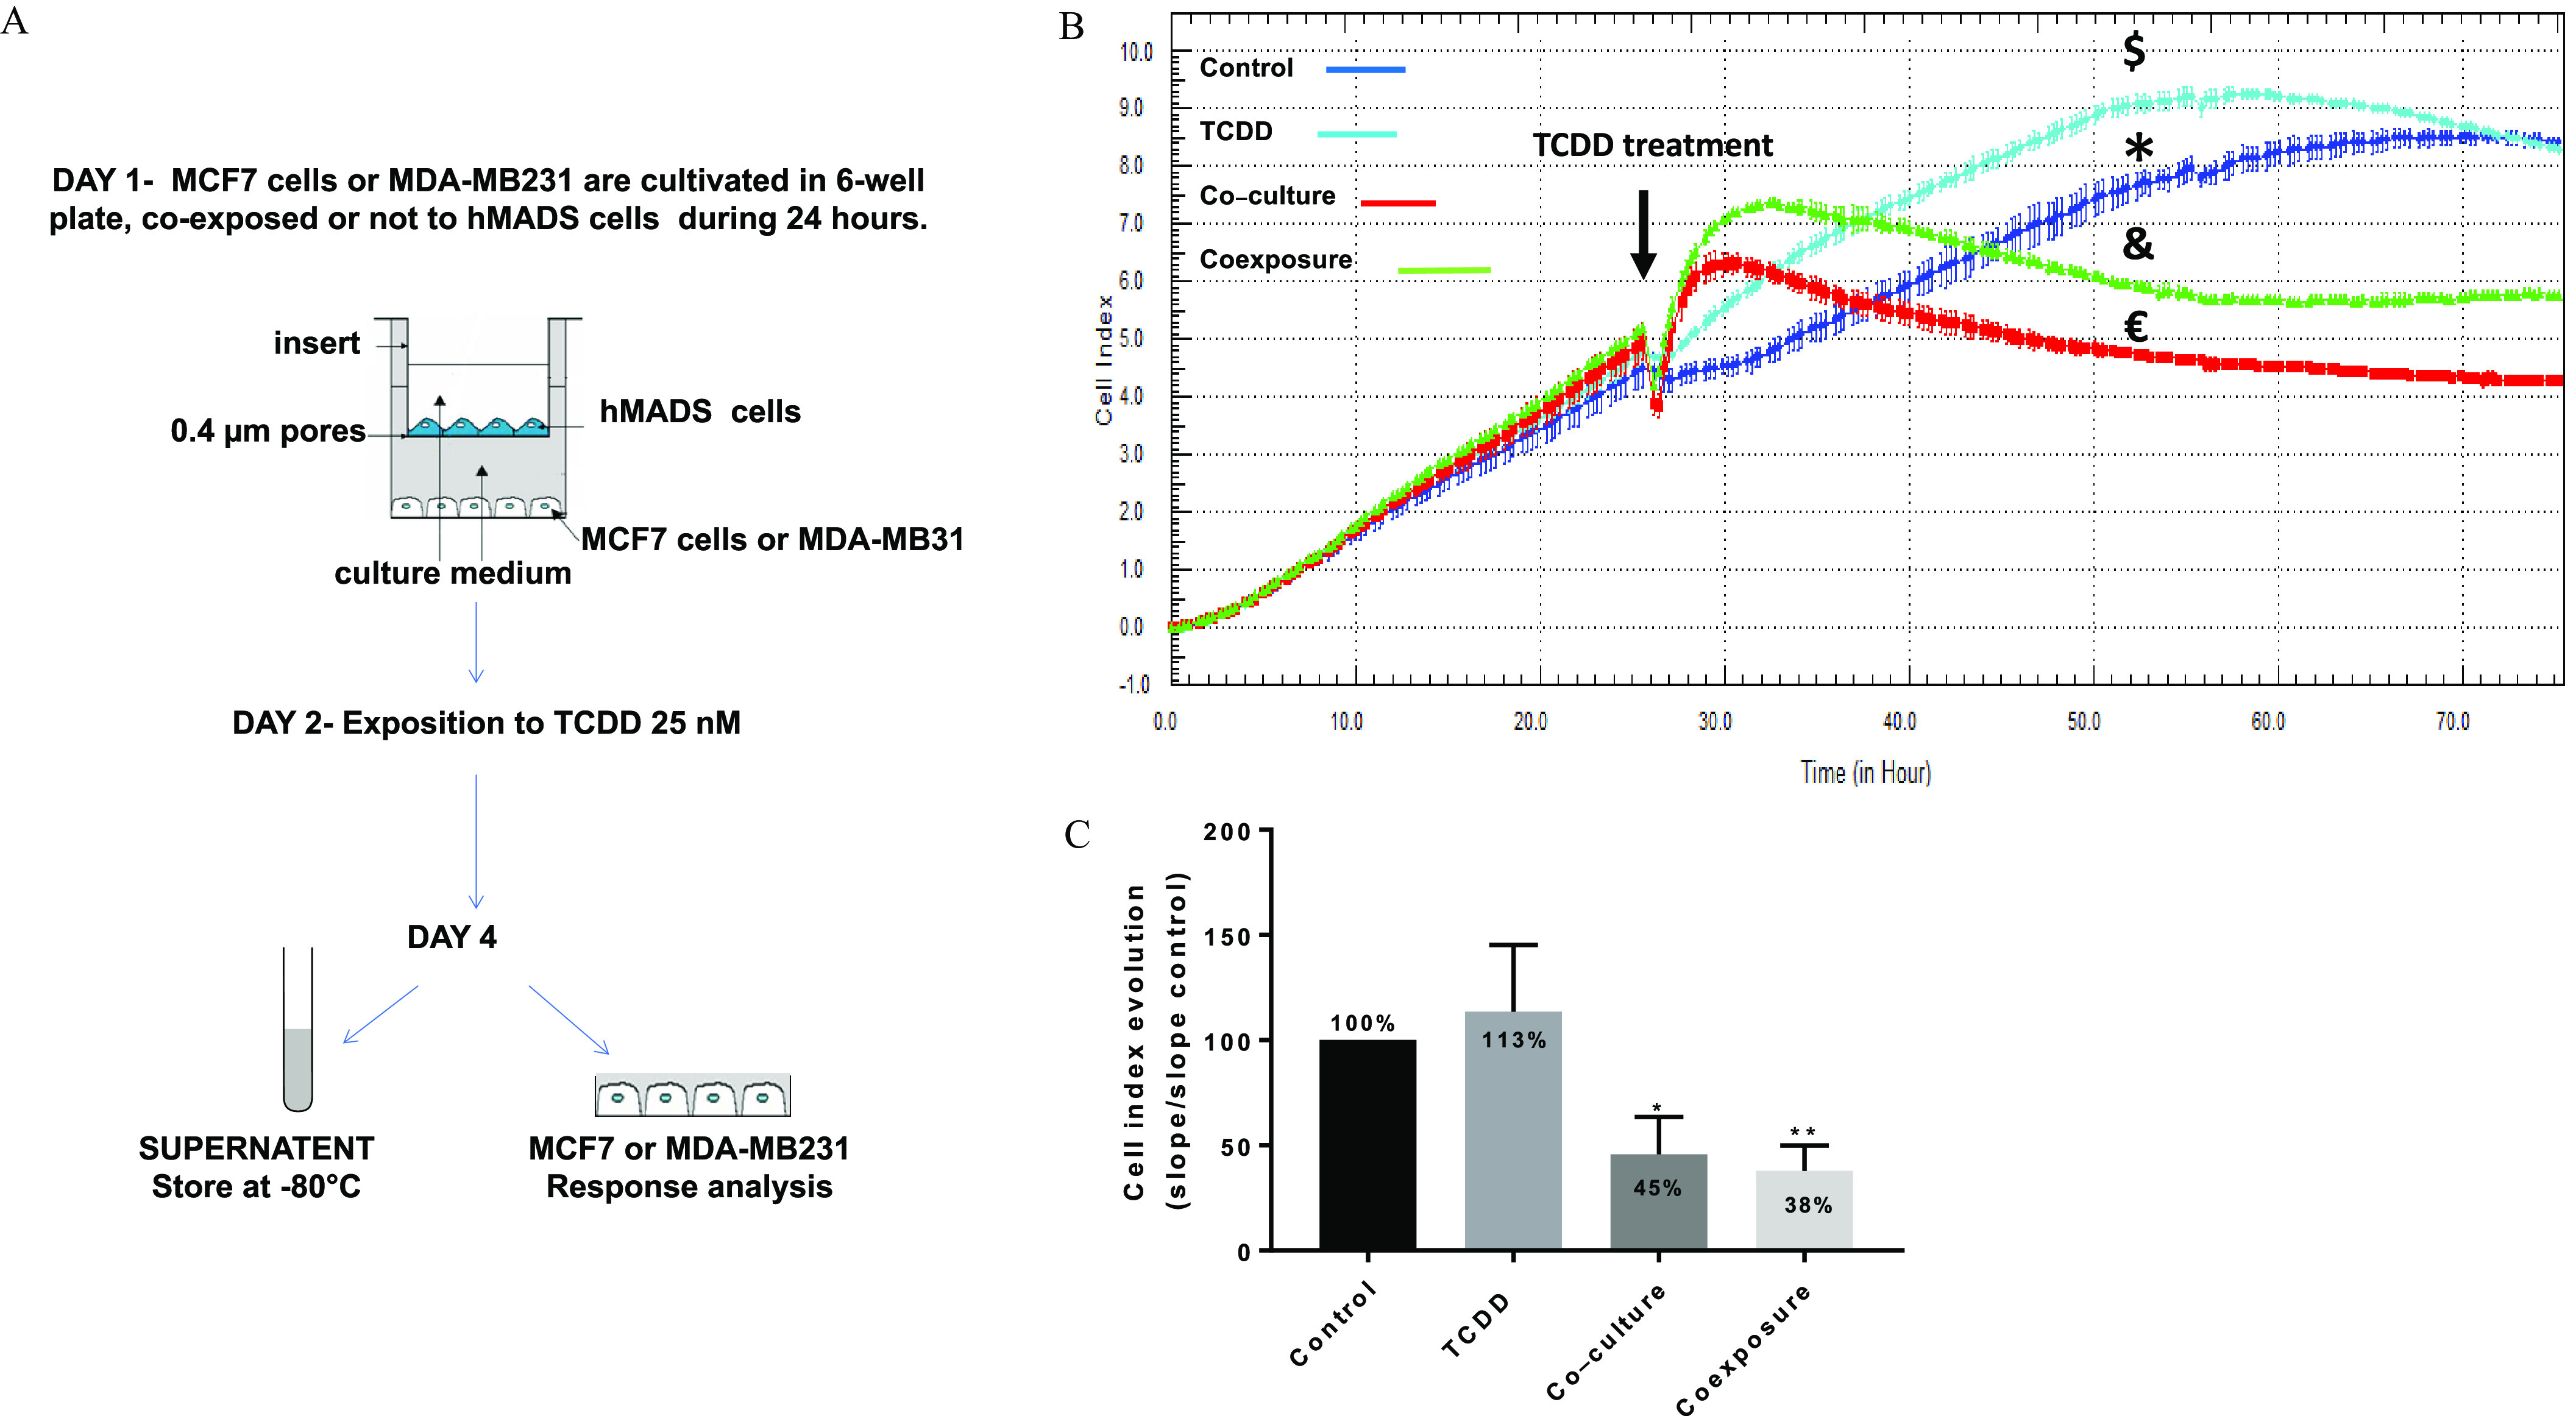
Co-culture model and real time MCF7 cells analysis. (A) Presentation of the 2D co-culture system and the protocol. (B) xCELLigence dynamic monitoring of MCF-7 cells, A representative graph from xCELLigence system: cell index (CI) profiles are the mean±SD (duplicate) of each condition: Control (*, vehicle MCF-7 cells, alone), TCDD ($, MCF-7 cells treated with 25 nM TCDD), co-culture (, MCF-7 co-cultured with hMADS) and coexposure (&, co-culture with TCDD). (C) The evolution of the CI for each condition was determined by analyzing the slope of the line in the interval (26–48 h). Each graph represents the mean slope (in bold) compared with the control±SEM for six measurements. The numerical information mean±SEM and p-values are provided in Table S1. (Kruskal–Wallis’s H test (nonparametric comparison of k independent series) followed by a 1-factor ANOVA test (parametric comparison of k independent series), **p<0.01; *p<0.05). Note: ANOVA, analysis of variance; SEM, standard error of the mean; TCDD, 2,3,7,8-tetrachlorodibenzo-p-dioxin.

Acknowledgments
This image is the copyrighted work of the attributed author or publisher, and ZFIN has permission only to display this image to its users. Additional permissions should be obtained from the applicable author or publisher of the image. Full text @ Environ. Health Perspect.