
|
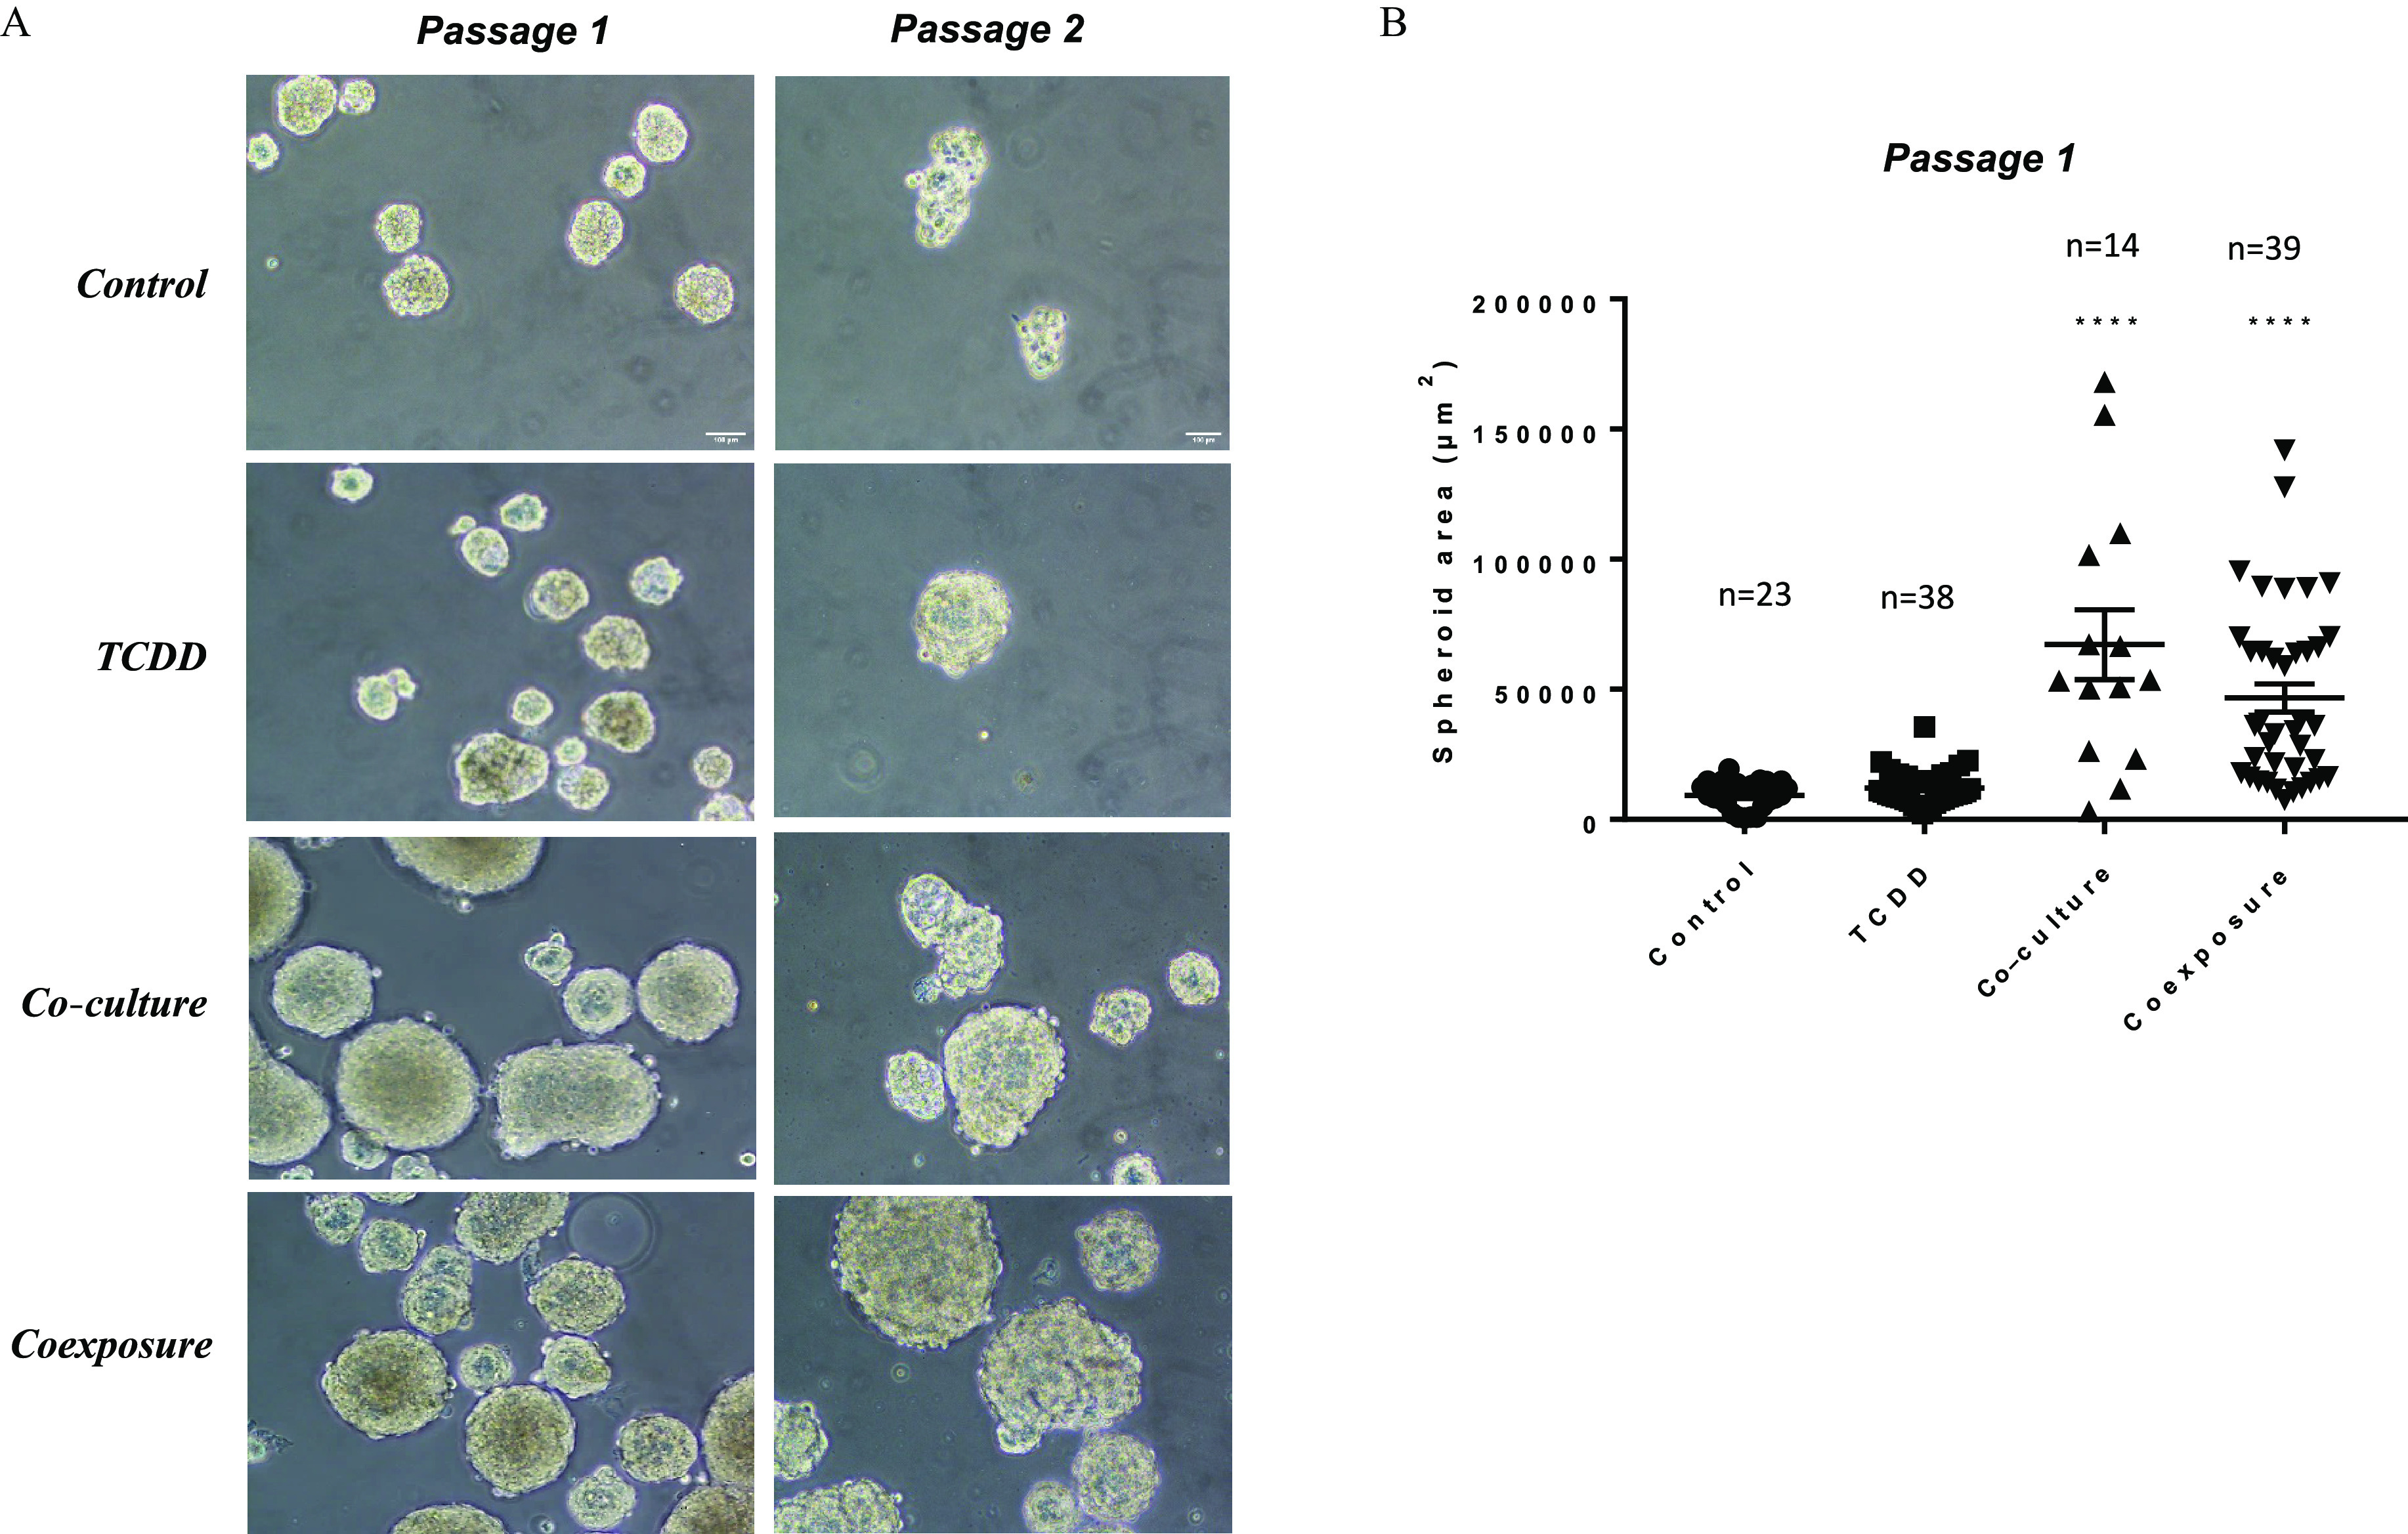
Figure 3. Sphere formation assay. (A) Representative images of sphere formation taken on day 7 on two consecutive generations. Only breast stem/progenitor cells can self-renew and grow into a spheroid structure. Control (vehicle MCF-7 cells, alone), TCDD (MCF-7 cells treated with 25nM TCDD), co-culture (MCF-7 co-cultured with hMADS) and coexposure (co-culture with TCDD). Scale bar 10μm . (B) Spheroid area (in μm2) in passage 1 using media from the various conditions. Graph represents means±SEM of n (see figure) measurements. The numerical information mean±SEM and p-values are provided in Table S3. Untreated MCF-7 cells alone represent the control condition (Kruskal–Wallis’s H test (nonparametric comparison of k independent series) followed by a 1-factor ANOVA test (parametric comparison of k independent series, **** p<0.0001 ). Note: ANOVA, analysis of variance; SEM, standard error of the mean; TCDD, 2,3,7,8-tetrachlorodibenzo-p-dioxin.