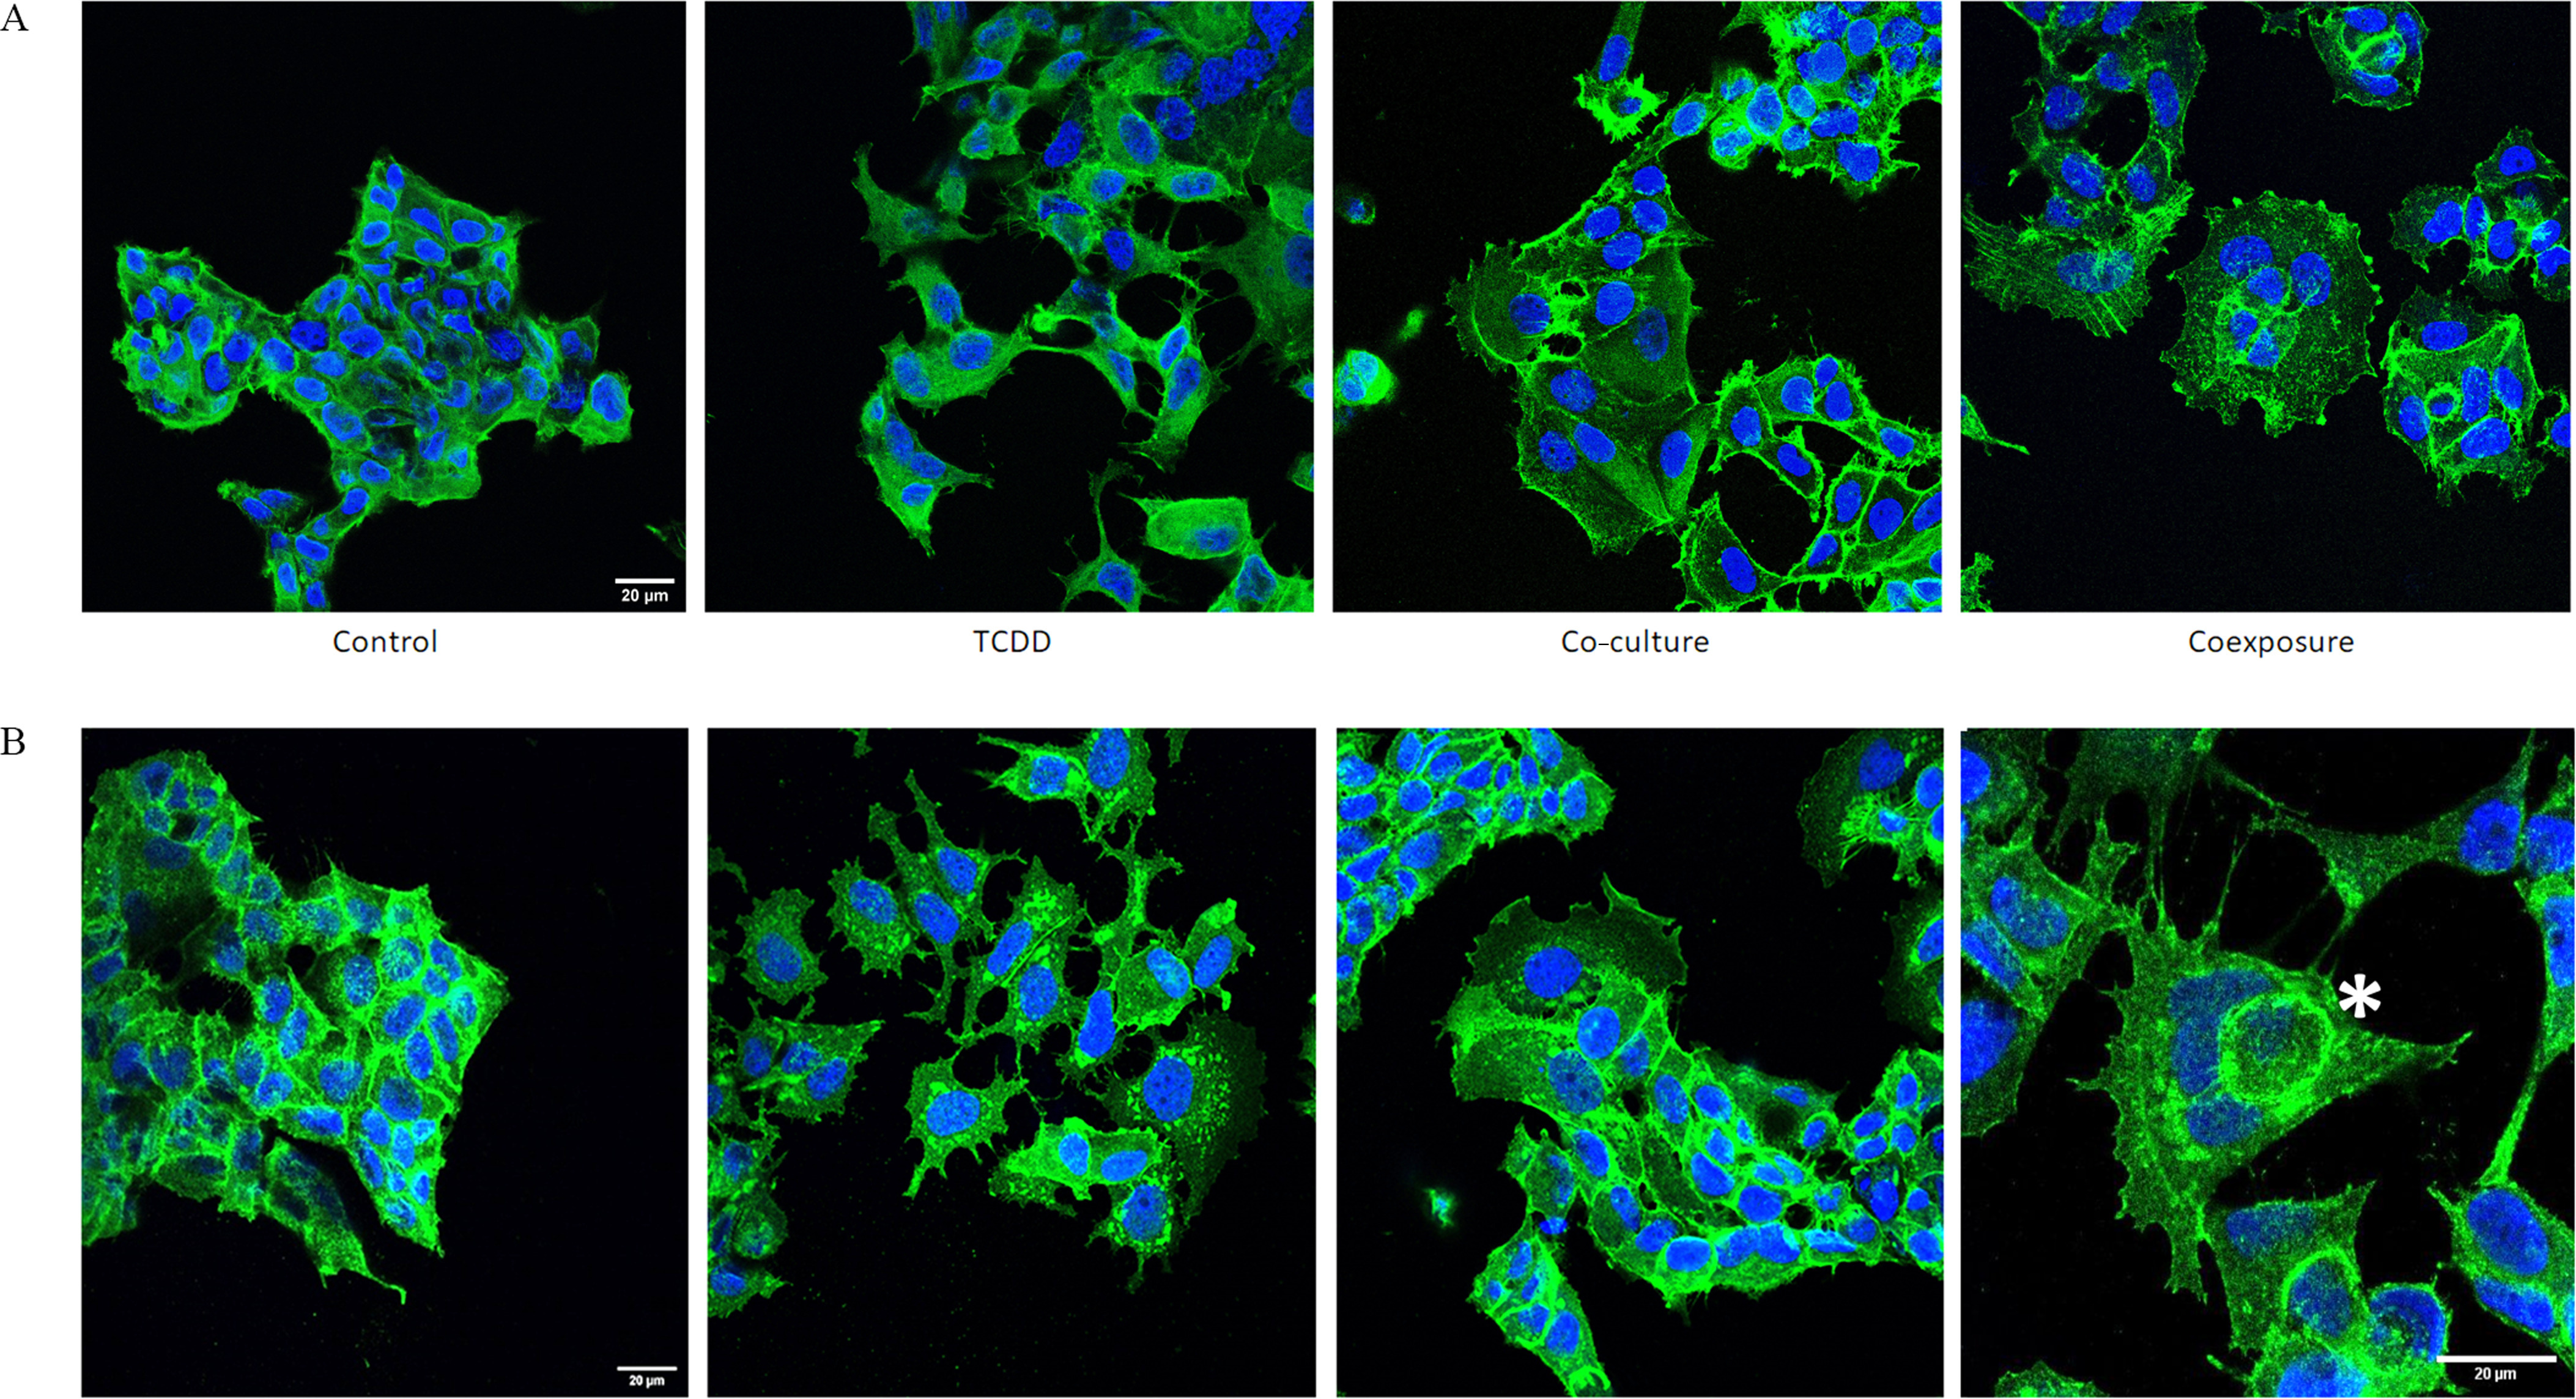
IMAGE

Figure 5.

ID
ZDB-IMAGE-210311-5
Source
Figures for Koual et al., 2021
Image
Figure Caption

Figure 5.

Protein (A-actin, B-beta-catenin) localization & nucleus staining in MCF7 cells and MDA-MB-231 cells. MCF7 cells were grown with hMADS and/or treated with 25 nM TCDD for 48h [Control (vehicle MCF-7 cells, alone), TCDD (MCF-7 cells treated with 25nM TCDD), co-culture (MCF-7 co-cultured with hMADS), and coexposure (co-culture with TCDD)]. (A) MCF7 cells were stained for actin (green) and nucleus (blue). Scale bar 20μm. (B) MCF7 cells were stained for beta-catenin (green) and nucleus (blue). One representative cell with cell-in-cell structures was marked with an asterisk (*). Scale bar 20μm. Note: TCDD, 2,3,7,8-tetrachlorodibenzo-p-dioxin.

Acknowledgments
This image is the copyrighted work of the attributed author or publisher, and ZFIN has permission only to display this image to its users. Additional permissions should be obtained from the applicable author or publisher of the image. Full text @ Environ. Health Perspect.