
- Title
-
Effects of SiO2 nanoparticles on the uptake of tetrabromobisphenol A and its impact on the thyroid endocrine system in zebrafish larvae
- Authors
- Zhu, B., Han, J., Lei, L., Hua, J., Zuo, Y., Zhou, B.
- Source
- Full text @ Ecotoxicol. Environ. Saf.
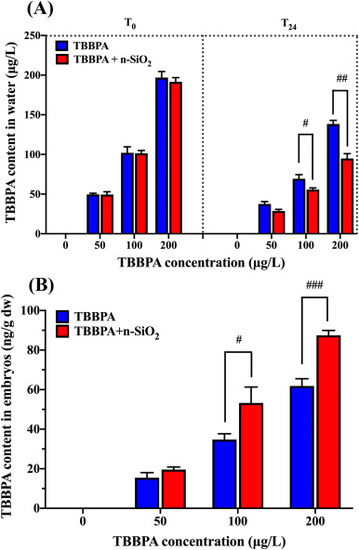
Fig. 1. Measured concentrations of TBBPA in (A) exposure solutions and (B) larvae. Data are shown as mean ± SEM of three replicate samples. Water was sampled just after (T0) and before renewal (T24). TBBPA contents in the control were below the LOD. #P < 0.05, ##P < 0.01, and ###P < 0.001 indicates significant difference between TBBPA single exposure groups and their corresponding co-exposure groups with n-SiO2. |
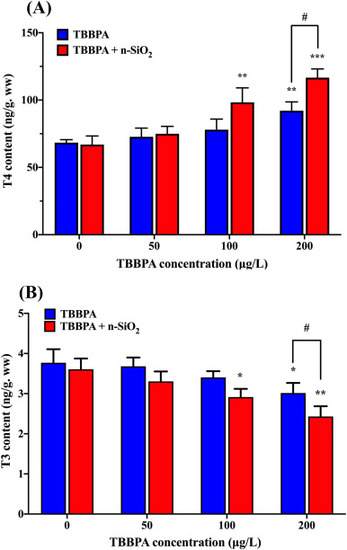
Fig. 2. Total T4 (A) and T3 (B) levels in zebrafish larvae after exposure to TBBPA (0, 50, 100, and 200 μg/L) alone or in combination with 25 mg/L n-SiO2. The TH levels in the larvae are expressed as ng/g wet weight. Values are the mean ± SEM of three replicate samples and each replicate contained 200 larvae. *P < 0.05, **P < 0.01 and ***P < 0.001 indicates significant differences between exposure groups and the control group, and #P < 0.05 represents significant differences between TBBPA treatment alone and co-treatment with n-SiO2. |
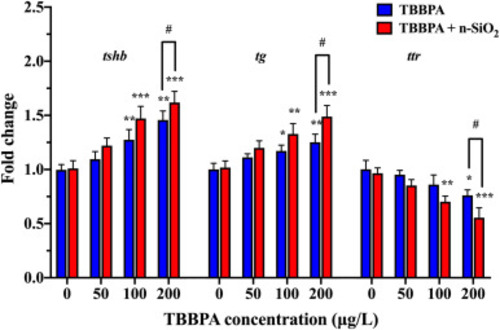
Fig. 3. Gene transcription profiles of larvae after exposure to TBBPA (0, 50, 100, and 200 μg/L) alone or in combination with n-SiO2 (25 mg/L) for 120 hpf. All data are expressed as mean ± SEM of three replicate samples and each replicate contained 30 larvae. *P < 0.05, **P < 0.01 and ***P < 0.001 indicates significant differences between exposure groups and the control group, and #P < 0.05 indicates significant difference between TBBPA groups and their corresponding co-exposure groups with n-SiO2. |
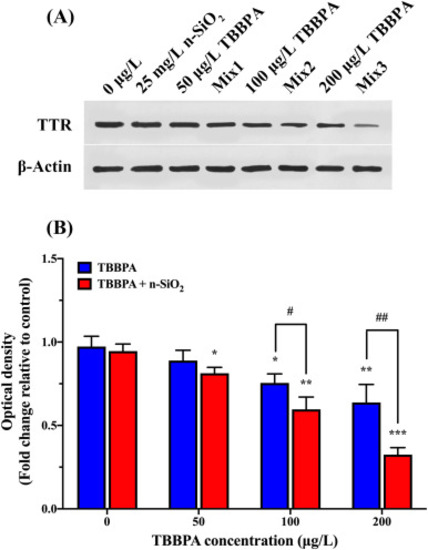
Fig. 4. Western blot analyses of TTR protein levels in larvae after exposure to TBBPA (0, 50, 100, and 200 μg/L) alone or in combination with n-SiO2 (25 mg/L) for 120 h. (A) Representative Western blots of TTR; (B) Quantification of the relative repression of TTR. Results are expressed as mean ± SEM of three replicate samples. *P < 0.05, **P < 0.01, and***P < 0.001 indicates significant differences between exposure groups and the control group, and #P < 0.05, ##P < 0.01 represents significant differences between TBBPA groups and their corresponding co-exposure groups with n-SiO2. |